The Data Diaries Archives - Page 2 of 3 - upGrad Campus

Data Science for Social Good: Leveraging Analytics to Address Global Challenges

Table of Contents

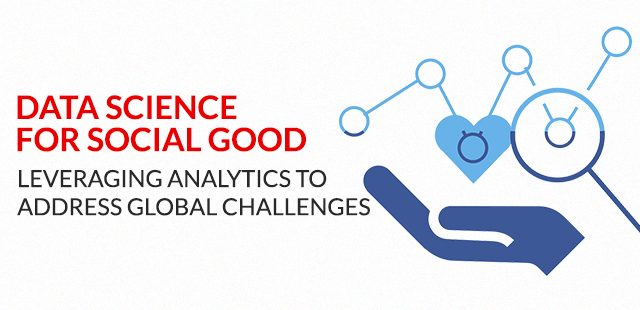
When the term ‘Data Science’ is mentioned, your mind would most likely jump to Data Analysts who target ads to consumers and maximise profits for businesses. But did you know that Data Science can also be used for social good?

From healthcare and education to poverty and climate change, Data Science for social good has the potential to transform how we understand and tackle global challenges!

In an era of insane technological advancements and an ever-increasing availability of data, the field of Data Science has emerged as a powerful tool for addressing complex societal problems. Which is why, in this blog post, we will explore the role of a Data Science certification course for social good.

Understanding Social Challenges and Identifying Opportunities for Data Science

 Understanding Social Challenges and Identifying Opportunities

Social challenges refer to complex issues in society, such as poverty, inequality, healthcare, education, and climate change. Data Science is now being used to address these challenges effectively.

It also enables evidence-based policymaking, enhances social impact initiatives, improves service delivery, promotes inclusivity, and fosters innovation.

Examples of Data Science for Social Good in Action

Examples of Data Science for Social Good in Action

A Bangalore based non-profit organisation ‘DataKind’ works with organisations like the World Bank to identify and analyse large data sets to ensure transparency and fight corruption. They also use Data Science to help reduce traffic related accidents and deaths.

Let’s explore some examples of how Data Science makes a positive impact on society.

Disaster Response and Relief Efforts:- The role of Data Science in disaster response and relief efforts include: predicting disaster paths and intensities, optimising resource allocation, analysing social media for situational awareness, assessing infrastructure damage through remote sensing data, and developing models for disease outbreak prediction and response.

In 2016, the NASA Earth Science mission launched the Cyclone Global Navigation Satellite System (CYGNSS). The objective of CYGNSS is to use data to substantially improve the ability to forecast storm surges, intensity, and path of cyclones.

Humanitarian Aid and Refugee Assistance:- Here Data Science is used in analysing demographic data, migration patterns, and social indicators to understand and address the needs of displaced populations. It helps identify vulnerable groups, and improve policy making. For example, Data Science can be used to predict refugee flows, assess healthcare needs, and coordinate the distribution of aid resources in refugee camps.

Since 2018, Microsoft has supported 61 AI for Humanitarian Action projects in 20 countries, advancing solutions to address challenges in disaster response, refugees, displaced people, human rights, and the needs of women and children through grants, technology donations, and data science support.

Community Health and Well-being:- Data Science contributes to the overall health and well-being of a community, by analysing healthcare data, socioeconomic factors, and environmental information.

Mumbai-based startup Qure.ai uses AI to make healthcare solutions affordable and accessible. It uses deep learning algorithms to interpret and radiology images and scans– chest X-rays, head CT scans, POQUS, chest CT scans, etc — within a couple of seconds.

Additionally, Bangalore based non-profit organisation ‘DataKind’ works with organisations like the World Bank to identify and analyse large data sets to ensure transparency and fight corruption. They also use Data Science to help reduce traffic related accidents and deaths.

Environmental Protection and Sustainability:- Data Science aids environmental protection and sustainability by analysing environmental data, satellite imagery, and climate models. It helps in monitoring deforestation, predicting pollution levels, and optimising resource management. Data science, for instance, can be used to build models for forecasting air quality, detecting places vulnerable to ecological damage, and maximising the deployment of renewable energy sources.

The National Remote Sensing Centre (NRSC), a programme under the supervision of the Indian Space Research Organization (ISRO), has engineered a new monitoring system to observe forest cover change and combat deforestation. By combining optical remote sensing, geographic information system, AI and automation, the new system allows monitoring experts to detect small-scale deforestation to further limit the damage caused to forests and to improve the frequency of reporting from once per year to once per month.

The Future of Data Science for Social Good: Emerging Technologies and Trends

Let’s explore the future of Data Science for social good which holds immense potential with emerging technologies and trends and impacts in addressing societal challenges and fostering positive change.

Artificial Intelligence and Machine Learning for Social Good:- AI and ML can be used for social good by addressing critical societal challenges. They have the potential to enhance healthcare, education, poverty alleviation, environmental conservation, disaster response, and more.
For example, a Bengaluru-based start-up ‘Niramai’ uses AI to improve the early detection of breast cancer. The company’s AI-powered platform, Thermalytix, uses thermography to detect breast cancer in its early stages, making it a non-invasive alternative to mammography.

Blockchain for Social Impact:- Blockchain technology has the potential to drive social impact by providing transparency, security, and efficiency. It can facilitate fair and accountable distribution of resources, such as donations and aid. Blockchain-enabled systems can enhance supply chain transparency, improve identity management for refugees and the unbanked, and enable secure voting systems.

Crowdsourcing and Citizen Science:- Crowdsourcing and Citizen Science harness the power of collective intelligence for social impact. Crowdsourcing involves engaging a large group of individuals to contribute ideas, data, or resources for solving complex problems and Citizen science empowers citizens to actively participate in scientific research, data collection, and analysis. These approaches enhance scientific knowledge, address environmental challenges, and foster public engagement, ultimately driving innovation and positive change.

Conclusion

Conclusion For Data Science Certification Course

By leveraging analytics and drawing insights from vast amounts of data, we can make informed decisions, design targeted interventions, and tackle issues ranging from healthcare and education to poverty and climate change. With continued advancements in technology and a commitment to responsible practices, Data Science has the potential to bring about meaningful and lasting change in our world.

Did this blog pique your interest in Data Science? Then checkout upGrad Campus’ Data Science certification course!

This Data Analyst course online has been specially developed for students and professionals in the early stages of their careers looking to build a successful career within this field.
Enroll today in our Data Science certification course and unlock endless possibilities!

Data Science Jobs, Salary Prospects and Best Training Programs in India

Table of Contents

Data has become new “oil” in the current market. All the companies in the world today run on data. And while we are moving closer every day to digitalisation, Data Science is becoming more and more crucial for corporate companies to advance business and target new customers. This has made data science and data analyst courses prominent and ever-growing fields with great future opportunities.

According to a report by Analytics India Magazine, the Indian Analytics industry is expected to grow at a CAGR of 30% and reach $16 billion by 2025.

In this blog, you will get a deep analysis about the jobs and career aspects of Data Science Jobs and the salary prospects in this field.

Importance of Data Science in India

Importance of Data Science in India

Data Scientists are in high demand in India. According to a report by Analytics India Magazine, the data science job market in India grew by 45% in 2021, with over 93,500 job openings across the country.

The salaries for Data Science professionals in India have also seen a significant rise. According to a report by AIM, the average salary for a Data Scientist in India is INR 12.7 lakhs per annum, which is an increase of 14.5% from the previous year.

Moreover, Data Science jobs are now needed in various industries in India, including healthcare, finance, e-commerce, and retail. And this field is growing unstoppably with the expansion of industries that are evolving to include Data Science for their business growth.

The Indian government has also set up several Data Science hubs across the country to promote research and development in this field. For example, the NITI Aayog, India’s premier policy think tank, has set up a National Data and Analytics Platform (NDAP) to enable the use of Big Data in policymaking.

The field of Data Science is currently in high demand and offers excellent remuneration to freshers. If you’re considering a career in this field, it’s worth noting that the pay is quite substantial. Let’s take a closer look at the expected salaries for Data Science jobs.

Salaries in Data Science Jobs

Salaries in Data Science Jobs

If you have completed or are pursuing your bachelors degree and are trying to find a field where you can earn up to 10 lakhs per annum in just your fresher days, then you can definitely go for Data Science courses.

Data Science is a completely new field and due to lack of awareness, many people do not know how with Data Analysis courses for beginners, you can earn a high paying job.

However, Data Science job salaries might depend on many factors like where you work or how much experience you have, how skilled you are and mostly how deeply you understand this field.

Average salary of a Data Science job can range somewhere between 10-12 lakhs per annum. However, a person’s salary might even go above 20 lakhs depending upon the above factors.

Above all, these salaries may completely depend on how much grasp and command you have on your skills. So, take good time in choosing where you learn your skills from and how well will this place help you gain a powerful grip over required skills and knowledge.

How to choose best place for Data Science Training

How to choose best place for Data Science Training

Malcom X, the human right activist once said “Education is the passport to the future, for tomorrow belongs to those who prepare for it today.” And for today’s preparation you need a good mentor.

Choosing a course which is new in this market and choosing the place to learn it from can be a daunting task. But here are some tips you can follow while you are choosing a place to learn it from.

Curriculum Analysis: – Check if the curriculum addresses industry-relevant subjects and utilises real-world case studies to explain concepts.

Faculty: – Check the qualifications and experience of the faculty staff working and teaching there. Look for relevancy and field experience and a strong background in Data Science. 

Placement support: Do not forget to analyse the placement rate and how much support the place is providing for the placement of their students and how well connected they are to the industry.

Learner’s Reviews and Feedback: Even if you are choosing a Data Analyst course online or an offline course, nowadays reviews  matter a lot. Check for authentic reviews by the verified students about the placement support, quality of the programme and mentorship provided.

Cost: Check and compare course fees with other educational platforms, so you can choose the one who can provide the best value for your needs.

If you are searching for a place which can fulfil all your checklist requirements, then we can help you with our research.

Conclusion

Conclusion

The one course that covers everything mentioned above is the Data Science and Data Analyst course online by upGrad Campus.

Even if you are not from a technical background, this course is one of the best Data Analyst courses for beginners, with a well-researched curriculum on an affordable fee and excellent one-on-one mentorship and support. So kickstart your journey in one of the most lucrative fields today with upGrad Campus.

Discover How Data Analytics is Leading the Way in the Future of Technology!

Table of Contents

  1. Uncovering the power of Data Analytics
  2. The Global Impact of Revolutionary Technology
  3. Careers and Opportunities in Data Analytics
  4. Certification Program in Data Science and Analytics by upGrad Campus
  5. Salient features of the Program
  6. Conclusion

Data Analytics is paving the way for the future of technology. As the world becomes more data-driven, businesses have turned to Data Analytics to help them make better decisions, stay up to date on the latest trends, and to make the most of their resources. By leveraging the power of Data Analytics, businesses can gain valuable insights into their operations, customers, and competition, which can drastically affect their bottom line. 

Let’s discover how Data Analytics is leading the way in the future of technology.

Uncovering the power of Data Analytics

Uncovering the power of Data Analytics

Data Analysis is the process of examining and interpreting large volumes of information to discover useful trends, relationships, and insights. This process can be complex and requires an organized approach and thoughtful analysis. Data Analysis often begins by collecting data from various sources such as surveys, daily transaction logs, market trends, customer feedback, and more. 

Once the data has been collected and compiled, the role of Data Analyst comes forward just like a Data Magician! Here are some of the tasks Data Analysts have to do as a part of their everyday responsibilities:


  • Data Mining : Sorting through extensive data sets to uncover connections and discover solutions for business problems by means of Data Analysis.
  • Statistical Analysis: Performing Statistical Analysis involves executing diverse calculations to detect hidden patterns and trends in data. 
  • Machine Learning : Data Scientists have to construct models for automated analysis from the given data. Driven by Artificial Intelligence (AI) , Machine Learning  focuses on the use of data and algorithms to imitate the way that humans learn, gradually improving its accuracy. 

Now that we have discussed what and how, let’s discuss why?

Why do we need a data-driven approach for businesses today? How is it affecting the performance and strategies for businesses?  

The world has gone digital, this we all know. But the internal competition between brands is on such high heels we can’t imagine. So, to be in the ballroom the need is to adapt the techs of Data Analytics. We can measure every possibility of market, customers and processes through Data Analysis and this will make the brand communication into a brand consideration among the customers. 

The more we digitize our Brand, the deeper we need insights.  

Good data is the foundation of effective data science. Without it, the famous adage “Garbage in, Garbage out” applies. A successful Data Science Product is like a recipe. If one component isn’t up to par, the end result will not satisfy the audience.


Important components of Data science

  • Business: Before designing a data-driven solution to a business problem, it is necessary to understand the business requirements and determine how data can be used to address them effectively. For example, if an airline is attempting to increase its customer base, the marketing team should research potential target demographics and the operations team should look into modifying flight times or increasing flights.
  • Math: Assuming you have gathered relevant data and comprehend the business objectives, the next step is to find a resolving method. Questions of which hypotheses to prove or disprove, or which techniques to employ in order to tackle a problem are addressed by Math or Statistics. 
  • Technology: Once the appropriate approaches have been determined and the hypotheses have been confirmed, Technologies, like Python and Machine Learning, are used to tackle the issue in the best and fastest way possible. Technologies enable us to efficiently prepare, execute and manage data models and perform regression analyses in the shortest time possible.

Exploring the Global Impact of this Revolutionary Technology

The Global Impact of Revolutionary Technology

Powered by vast amounts of data and computing capability, Data Analytics is indeed a revolutionizing factor globally. Its application is not only for understanding the customer for the business; it affects a lot of sectors in planning strategies and defining insights for long term goals. Here’s just a small sampling of the applications that Data Analytics serves – 

  • Marketing – Marketing agencies use the analytics to judge their campaign outcomes and the TG that they followed for further advertisements which can evolve as better ROI Model, outcomes predictions and strategic implementations. 
  • People – People Analytics is used to understand the behavioral data of the people that are engaged with the companies’ products or services. It’s not limited to the promotional aspect but also to the workforce sector in terms of talent acquisitions, capital involved in maintaining the workforce and others. 
  • Portfolio – Banks or any lending organization has the collection of portfolio data consisting of the value accounts and the risked accounts in circulation and the investment follows. 
  • Risk – Any time you have planned for having any credit card or loans from any bank, you must have faced the pressure up to the ceiling of maintaining your CIBIL Score or Transactional score. We understand this, but don’t you wonder how this is done with just a click? It’s Risk analytics from the backend which evaluates the risk score of an individual and also determines if your financial plan succeeds or fails. 
  • Digital – We use Digital Analytics to define, create, collect, verify, and transform data into corporate insights, research, reports, recommendations, optimizations, and automations. Our goal is to help businesses better understand their activities and unlock new opportunities for growth. The performance of a digital marketing is based only on its deep study of analytics. 
    Marketing Strategies + Analytics = Performance Matrix

  • Security & Software – Security Analytics is used by companies for understanding and measuring the functions of an IT product that have higher risks. Software analytics is needed to ensure a software product is bug-free and safe to use. 

By allowing businesses to quickly digest vast amounts of data, analyze it and take action, Data Analytics has become a crucial part of successful operations. The global impact of Data Analytics is vast and is still growing. From predicting customer behavior to optimizing operations, Data Analytics is helping companies across the world make smarter decisions, faster. 

One of the biggest areas where Data Analytics is having a global impact is customer segmentation. By analyzing customer behavior and lifestyle preferences, companies can segment their customer base and target their marketing activities more effectively. 


Career Opportunities in Data Analytics

Data Analytics is one of the hottest career opportunities in the world today. To pursue Data Analytics as a career, you’ll need a strong knowledge base in? followed by certification in Data Analytics from a recognized institution. Employers often seek out candidates who possess high intelligence and problem-solving skills and those who have gained industry exposure while doing their certification in Data Analytics. 

It is an exciting and rewarding career which can provide tremendous opportunities in this digital era. It’s important to be aware of the data and analytics landscape before diving into the field. 

People with a diverse range of skills can add value in the world of Data Analytics, and the possibilities are endless. Data is the key to unlock hidden potential within businesses, enable organizations to make more informed decisions, and as such, data analysts will without a doubt serve as a spinal cord to any business in the coming years.

Certification Program in Data Science & Analytics By upGrad Campus

Certification Program in Data Science & Analytics By upGrad Campus

To help students or aspiring Data Science Professionals to stay current with the latest industry trends, upGrad Campus offers an industry-recognized Certification Program in Data Science & Analytics. This program covers both theoretical and practical components of Data Science and Analytics.Designed to help you master the most cutting-edge industry tools, this program helps students to advance their Data Science Skills, grants them access to hands-on applications and analyses across a range of practical scenarios, and will even help them get hired by some of the world’s leading data-driven companies.

The program is ideal for individuals who are looking for Digital Analytics Courses to switch fields, or need to learn the required skills to develop their knowledge. 

What’s on Trend? What’s on the News? What’s being served to the current market? – all these questions can be answered with this course in Data Analytics. 

Salient features of the Program

  • 6 months online Data Analysis and Data Science course for beginners 
  • Live and recorded learning sessions 
  • 300+ hiring partners
  • Covers Inferential Statistics, A/B Testing, Regression, Clustering, Decision Trees
  • Taught by the most renowned Data Scientists in the country today.
  • Hands-on experience with tools like Excel, Python, SQL, Tableau, Kaggle and more in live projects
  • Guaranteed certification that will help your CV stand out

Conclusion

Conclusion

Though it may seem daunting, the advantages of Data and Digital Analytics Courses are numerous and with proper training, the world presents multiple opportunities for those who are looking to enter the Data Science and Analytics field. upGrad Campus’s Certification Program in Data Science and Analytics is an ideal choice for those looking to gain the skills and confidence to stay competitive in this industry.

What is Data Analytics and why is it useful?

Table of Contents

Have you seen any of the job sites of late? Naukri.com or Linkedin? The top trending searches are Data + <Analyst/Scientist/Engineer> and the list goes on. Clearly, data is the new oil in today’s times. And while there are various career options in the field of managing and processing data, in this article, we will specifically cover everything you need to know about Data Analytics.

Starting with the most important question – what is Data Analytics?

Understanding Data Analytics Basics

Data Analytics empowers businesses to make informed decisions and improve their operations, and at the heart of all this lies data. Data Analytics is a branch of Data Science and it involves collecting, examining, cleaning, transforming and modelling data. Using this, organisations are able to discover useful information, draw conclusions and make operational decisions that will meet their organisational objectives.

Did we lose you in jargon? 

Before we go deeper into the Data Analysis definition, let us try understanding what is data and information. In a nutshell, data is raw, disorganised facts and figures. Information is data that has been processed, organised and presented in the right context. Data Analytics looks at the raw data, converts it into meaningful information so that organisations can make informed decisions. 

Let us understand this process with an example.

Data Analysis Steps with Examples

Imagine if you owned a clothes store called Marvel-ous Threads that sold MCU merchandise like figurines, T-shirts, keychains and more. You want to launch a new special edition T-shirt before the upcoming movie gets released. 

Here’s how you’d use Data Analysis.

Step 1) Define the problem and objectives: Your first step would be to figure out what the problem you are trying to solve is. That way, you will be able to clearly define what is the key objective of data analysis. In our case, understand what your customers are into and how you can drive the sales of special edition Marvel-ous Threads T-shirts.

Step 2) Data collection and preparation: Next, you’ll collect all the data from various sources, such as surveys, store databases, spreadsheets, etc. You will clean, format and prepare the data so that it is analysis-ready. For Marvel-ous Threads, you may want to fill in missing data like age groups, gender on the basis of name, or remove irrelevant and duplicate data, like buying 3 shirts of the same type or even socks. 

Step 3) Data Visualization: A picture is worth a thousand rows and columns. So your next step is to represent the purchase behaviour of your customer in easy-to-understand forms like histograms, scatter plots, or box plots. That way, you can correlate the data and answer queries like “Which season do most shirts get sold in the district of Asgard-borough?”  

Step 4) Data Modelling: Next, you will use a Machine Learning model to analyse the data and get insights. For example, you can use linear regression to understand how the price affects the sales of the shirts. And then you can arrive at an optimum price that will enable you to meet the required sales and still remain profitable. 

Step 5) Communicate the results: Following the above data analysis and interpretation, it is very important for you to communicate the results to the relevant teams and decision makers through reports or dashboards.

Step 6) Plan of action: Once all the stakeholders have reviewed the results of the data analysis, it is important to come up with a plan of action and implement it. For example, you may end up with special offers for the Marvel-ous Threads T-shirts during the movie launch season.

Data Analytics Techniques

Data Analytics Techniques

Now that you understand what is data analytics, let us look at some of the techniques to perform data analysis.

Regression Analysis

Regression Analysis is a statistical method used to determine the relationship between a dependent variable on two or more independent variables. Taking our Marvel-ous Threads example, the number of sales depends on the price of the T-shirt. It may also depend on the age group of the customer. In this case, the number of sales is a dependent variable; the price and age group are independent variables. With Regression Analysis, we can map a relationship between these variables.

Factor Analysis

With Factor analysis, you can identify the variables that contribute to being a factor in a relationship. In our Marvel-ous Threads example, the customer data captured could be name, age, gender, location, phone number, email address, etc. Now some of the factors that have nothing to do with the amount of sales would be name, phone number and email address. Factor analysis helps eliminate these variables from the data analysis, and also determine how exactly age, gender and location are related to the sales of the T-shirts.

Cohort Analysis

Cohort Analysis is a way of grouping different entities together into a cohort based on a common characteristic. For example, all women from ages 25 to 33 living in Asgard-borough could form one cohort and all women from ages 21 to 24 living near Antman-shire could form another cohort. Now Marvel-ous Threads needs to understand which cohort performs better during which months, etc. to make their marketing decisions.

Time Series Analysis

As the name suggests, Time Series analysis involves the factor of time. For example, which are the months when Marvel-ous Threads have the most sales? Is it near a festive season or during a franchise launch? Does the T-shirt sales drop over winter and that of a jumper increases?

Data Analytics Tools

All of the above techniques are implemented using data analysis tools. The most common data analysis tools include:


  • Excel: Excel is an easy-to-use interface for building reports, charts and pivot tables, along with complex functions and formulae.
  • Python & Python libraries: The large number of libraries and frameworks make Python practically an indispensable skillset for data analysis functions like linear regression, data transformation, etc.
  • Tableau: Tableau is a data visualisation dashboard that is used to make charts, treemaps, histograms and other elements for effective data storytelling.
  • MySQL: MySQL is an open source relational database management system that is used for storing, extracting and manipulating data. It is usually used in combination with a programming language like Python.

Why is Data Analytics Important?

Why is Data Analytics Important?

Having seen how Marvel-ous Threads would use data analysis, you should be able to answer the question – why is data driven analytics of interest to companies? If not, let’s clarify it further:

  • Data Analytics allows companies to identify trends and patterns, measure performance, and make predictions.
  • Data analysis in research, specifically corporate research, is one of its biggest uses. Data analytics is used in:
    • Market research (e.g. consumer preferences)
    • Customer analytics (e.g. consumer segmentation)
    • Financial analysis (e.g. revenue forecast and budgeting)
    • Operational analysis (e.g. where efficiency can be improved)
  • Data Analytics also helps uncover areas of improvement, detect fraud, and understand risks and investments to make informed decisions.

What are the 4 Types of Data Analytics?

When we explained what is Data Analytics, we spoke of deriving insights from data. Based on the data you’re analysing and the type of insights you want to derive, Data Analytics can be divided into 4 categories:


  • Descriptive Analytics

    To put it simply, Descriptive Analytics describes a story. It views historical data and presents the same in a summarised form to explain what happened in the past. For example, the sales history of Marvel-ous Threads T-shirts in a particular region.

  • Diagnostics Analytics

    As the name suggests, Diagnostics Analytics diagnoses historical data to come up with a root cause of a problem/trend. For example, why are the sales of Marvel-ous Threads T-shirts higher for men than women?

  • Predictive Analytics

    Predictive Analytics is used to make predictions on future trends and events based on the analysis of past data. For example, how many Quantamania T-shirts can be sold by Marvel-ous Threads based on the sales of Loki T-shirts?

  • Prescriptive Analytics

    Prescriptive Analytics takes all other types of analytics a step further and makes recommendations to meet certain objectives. For example, Prescriptive Analytics for Marvel-ous Threads will recommend which areas/customer segments need more marketing to get good sales, and which areas are not worth investing in.

Data Analytics and its Future Scope in 2023

As the world is getting increasingly reliant on data and tech, the scope of Data Analytics is correspondingly expanding too. Data Analytics will definitely impact all important industries like:

  • Healthcare – From Electronic Health Records (EHR) to Clinical Decision Support, Data Analytics will improve patient experience and also improve operational efficiency for hospitals and healthcare providers.
  • Finance – Data Analytics will strengthen existing financial systems by analysing spending and purchasing patterns. This will be used in fraud detection, portfolio management, predicting stock prices, etc.
  • Retail – As already explained with Marvel-ous Threads, Data Analytics will find increased usage in customer segmentation, purchase behaviour analysis, sales forecasting and more.
  • Telecommunication – As the number of internet users keeps growing, Data Analytics will play a big role in network optimisation, fraud detection, usage pattern analysis and prediction, etc.
  • Manufacturing – There are many processes which can be optimised with Data Analytics in the manufacturing side. These include – energy efficiency, supply chain, quality control, inventory management, etc.

These exciting career opportunities will also seen an explosion in the roles of:

  • Data Analysts
  • Data Scientists
  • Data Engineers
  • Machine Learning Engineers
  • Data Visualisation Designers


and more!

Data Analyst vs. Data Scientist

As we look into the career opportunities in the field of Data Analytics, there’s an important point we need to address. And that’s the difference between Data Analysts and Data Scientists.

Many mistakenly confuse the two; but while the two fields are closely related, they are and must be treated separately.

A data analyst’s primary focus is to clean, transform and present the data using which insights can be made. A data scientist takes this data a step further and also builds Machine Learning models to extract meaningful insights from the data. So, in the case of Marvel-ous Threads, a Data Analyst will collect the details of the sales of new T-shirts in every area for every type of customer in the last 3 months, remove the unnecessary data and present the details in contrast with the marketing spends. A Data Scientist will build predictive models to understand where the marketing efforts are high-paying to maximise the sales.

Conclusion

Conclusion

We hope this definitive guide on Data Analytics has answered all your queries on kickstarting a career in this exciting field. The best place to start is our Data Science & Analytics course, which is designed specially for beginners. 


Interested in knowing more? Ask your questions in the comments below.

What is data science: Importance, tools, benefits and future scope

Data science and Data Analytics have become an essential part of every industry in the last decade. They have helped companies reduce costs, conduct thorough market analysis and mainly predict outcomes using predictive models. But if you were asked what Data Science is, or better yet, who is a Data Scientist, what would you say? Let’s find out.

What is Data Science?

Data Science is the field of study that is mainly used to deal with extremely large data sets. In this field, Data Scientists program complex algorithms and use other modern tools to discover new patterns and key insights for their organization. Data Science is used in almost every field now, be it Medicine, Defence, Banking or even Weather forecasting, it plays a crucial role in the way the world works today. But where did Data Science emerge from exactly?

History of Data Science

The term ‘Data Science’ was coined in the 70’s to describe a field of study that would draw insights from the vast amounts of data being collected at the time. Data Analysis was a precursor to Data Science, and first gained popularity in 1962 when famous statistician John Turkey wrote the article ‘The Future of Data Analysis’. Turkey was talking in relation to the addition of computers to the field of statistics.

Fast forward to 1974, 12 years after the coining of Data Analytics, Peter Naur used the term Data Science repeatedly in his book ‘Concise Survey of Computer Methods’. Naur was one of the first people to write a definition of Data Science.

Fast forward to 2008, DJ Patil of Linkedin and Jeff Hammerbacher of facebook, caused a massive buzz around the word ‘Data Scientist’. This inturn created a massive boom in the industry that actually led to Harvard university to label Data Science as the sexiest job of the 21st century.

Present day, Data Science is now defined, with certainty, as a field that forms valuable insights from Big Data.

Why Data Science Is Important

There is a reason they call data the new currency. Almost every industry we know today is data driven, which is why a field of study that can make sense of the unfathomable amounts of data we generate every minute. Data Science pushes industries to make the best possible decisions by providing data backed predictions. Let’s take a look at some of the applications of Data Science to better understand their importance.

  • Helping with better decision making on a management level
  • Setting goals by analyzing trends and directing actions accordingly
  • Encouraging the team to implement effective methods and prioritize important matters
  • Spotting potential opportunities
  • Making decisions based on measurable, data-based evidence and evaluating their effectiveness
  • Identifying and refining the target audience
  • Hiring suitable individuals for the organization.

The Future of Data Science

The future of Data Science does look very promising. With the increasing amount of data being generated, Data Science is becoming a crucial tool for businesses and organizations to extract insights, make data-driven decisions, and improve their operations. As the demand for Data Science increases, many new opportunities and applications of it will emerge in various industries such as healthcare, finance, transportation, and more.
The future of Data Science also includes advancements in technology such as the integration of machine learning algorithms in Data Science, Big Data, and Cloud Computing. This will enable more advanced data analysis and predictions. Additionally, with increasing focus on data privacy and security, there will be a growing need for experts who can handle and protect sensitive data and use the up and coming Data Science technologies.

What are the benefits of Data Science for businesses?

What are the benefits of Data Science for businesses?

Data Science is a powerful tool that businesses can use to gain a deeper understanding of their operations and the marketplace. By making use of data science, businesses can gain valuable insights and predictions that help them to make complex decisions with more confidence and accuracy. Data Science also helps businesses make:

Discover unknown transformative patterns

Using a variety of tools such as data exploration, anomaly detection or machine learning algorithms in Data Science can help businesses find patterns from historical data. These patterns can help businesses make new innovations or revive past schemes – to better their businesses.

Innovate new products and solutions

Data science can help businesses innovate new products or solutions by providing them with valuable insights and predictions about their customers, market, and industry. Data scientists can give insights on customer needs and market trends which can aid in the innovation of new products or solutions.

Real-time optimization

Uses of Data Science include, being able to optimize product development by identifying patterns in engineering data such as design, testing and manufacturing data. This can help businesses to identify new opportunities for product improvement and increase efficiency in the product development process.

What are Data Science Processes?

Now that we have seen what Data Science does, let’s take a closer look at what processes are used to derive those key insights.

  • Obtain data – Collect and acquire the necessary data for the analysis.
  • Scrub data – Clean and prepare the data for modeling by handling missing or incorrect values, and dealing with outliers.
  • Explore data – Analyze the data and identify patterns, trends, and relationships. This step is also known as “Exploratory Data Analysis” (EDA).
  • Model data – Use statistical or machine learning techniques to build a model that can make predictions or draw insights from the data.
  • Interpret results – Communicate the results of the analysis to stakeholders and make recommendations based on the findings.

The Basic Principle behind Data Science techniques

The Basic Principle behind Data Science techniques

Data science techniques are based on the principle of extracting insights and knowledge from data using statistical, mathematical and computational methods. The goal is to uncover patterns and trends that can inform decision making and support the prediction of future outcomes. If we were to dive deeper into Data Science concepts and techniques, this is what we would find:

Classification

Classification is a technique in data science where a model is trained to predict a category or label for a given input data. It is a type of supervised machine learning where the model is trained on labeled data and then used to predict class labels for new, unseen data.

Regression

A technique in data science where a model is trained to predict a continuous output value for a given input data. It is a type of supervised machine learning, where the model is trained on labeled data containing input-output pairs and then used to predict output values for new, unseen data.

Clustering

A technique in data science where a model is trained to group similar data points together. It is an unsupervised machine learning method, where the model does not have any labeled data and is used to discover the inherent groupings or structure in the data. Common algorithms used for clustering include k-means, hierarchical clustering, and density-based clustering.

What are different Data Science tools?

We know by now, Data Scientists help predict future trends and gain insights, but what tools do they use to make this all possible?

  • Data storage – Data storage is a critical tool in data science as it enables the collection, organization, and preservation of large volumes of data. Data storage systems can range from simple file systems to complex databases, depending on the size and complexity of the data.
  • Machine learning – Machine Learning algorithms in Data Science, are used to build models that can automatically learn from data and make predictions or draw insights.
  • Analytics – Analytics is the process of examining data to extract useful information, draw conclusions, and support decision making. In data science, analytics in identifying trends, tracking performance, creating predictive models and making forecasts.
  • Modeling – Modeling is the process of creating mathematical representations of a system in order to understand and make predictions about it. Modeling is used, by Data Scientists, to build predictive models that can automatically learn from data and make predictions or draw insights.
  • Programming – In Data Science, programming is used to manipulate, analyze, and visualize data, as well as to implement machine learning and statistical models.
  • Statistics – Statistics is the study of collecting, analyzing, interpreting, and presenting data. It is used to understand and make inferences about data by using methods such as descriptive statistics, inferential statistics, and statistical hypothesis testing.

Conclusion

Conclusion

In conclusion, Data Science is a vast field that uses various methods and tools such as Machine Learning, Analytics, Modeling etc. to gain deeper understanding and key insights from data. If you’re interested in knowing how to become a Data Scientist, and want to join this insanely cool field, check out our Data Science and Analytics course. One of the many things you will learn in this course is Python programming from scratch with specific use cases in Data Science. Our course also gives you the chance to build an impressive portfolio with multiple projects spanning from data cleaning and data manipulation to data visualization. If you want to learn what Data Scientists do or discover who a data scientist is check out our video ‘Data Science Explained’.
If you liked learning all about Data Science, leave a comment below and let us know which topics you’d like us to cover next.

Which is better? Business intelligence or Data Analytics?

Data driven industries often throw around the words Business Intelligence and Data Analytics, but as someone new to the industry do you truly know the difference between these terms?
In today’s Blog we’re going to work out the differences between the two and once and for all settle the debate as to which is better – Business Intelligence or Data Science?

Starting with what is BI?

What is Business Intelligence?

What is Business Intelligence?

To explain this simply, we can split the definition of Business Intelligence into 2 parts:

  1. The processes, tools, technologies used to gain valuable business insights from large amounts from raw data.
  2. The output of the process – the business insights themselves. Going forward let’s keep both the processes and the outcomes in mind when we talk about Business Intelligence.

When we talk about processes, we’re referring to the conversion of raw data into meaningful business insights. These are the techniques in order to achieve that:

  • Real-time monitoring
  • Dashboard development and reporting
  • Benchmarking
  • Implementation BI software, like Power BI
  • Performance management
  • Data and Text mining

How does Business Intelligence work?

We all know that in simple terms BI takes raw data and converts it into meaningful information, but how exactly is that achieved? Let’s take the above mentioned processes and explore them a little more.

  • Real-time monitoring – It is the process of collecting and storing performance metrics (the set parameters tell you how well your campaign is doing) as and when it crosses your network.
  • Dashboard development and reporting – A Dashboard portrays your data in the form of graphs, charts, etc. All your data is presented together visually, making it easy for you to catch-up faster.
  • Benchmarking – It is the process of comparing the metrics you collected with the numbers present in the industry. 
  • Implementation of BI software – Softwares and tools like Power BI, SQL etc, will help you collect, clean and present data in the form of powerful visuals. 
  • Performance Management –  The process of ensuring that certain goals at the start of a campaign are met. 
  • Data and Text Mining – It is the process of discovering patterns and information from large data sets. It makes use of machine learning, statistical analysis and more. 

Examples of Business Intelligence

So where is Business Intelligence used? (Just about everywhere)

Customer Interactions

BI can help you build a dashboard that shows you all customer interactions across all platforms. This can help you get a complete picture of the service you’re providing without having to manually go through every platform.

Website Traffic

Business Intelligence can help you effectively track website traffic.

What is Data Analytics?

What is Data Analytics?

Data Analytics is a process of collecting, cleaning, inspecting, transforming, storing and modelling. In truth you can say that Data Analytics is a tool used in Business Intelligence to make informed decisions, however Data Analytics is used in many many more fields to find valuable insights. Other than Businesses, Data Analytics is used by:

  • The Medical Industry
  • The Government
  • The Education System
  • Research

So what is the difference between Data Analytics and Business Intelligence? Let’s find out!

The differences between Business Intelligence and Data Analytics

To further elaborate on the broad differences between BI and Data Analytics, we have put together a list of different concepts or techniques the two use.

Using insights vs. creating insights

  • BI uses insights to make informed decisions.
  • Data Analytics, uses various analytical tools and techniques to to find these insights in the first place

Backward-looking vs. Forward-looking

  • Business Intelligence mainly focuses on looking at historical data to discover trends and make better decisions.
  • Data Analysis on the other hand, uses historical data to discover patterns and trends that can be used for forecasting or Predictive Analysis.

Structured vs. Unstructured data

  • Business Intelligence makes use of structured data, collected from data warehouses.
  • Data Analytics on the other hand, starts off with the process of cleaning, sorting and storing unstructured data.

Non-technical users vs. Technical users

  • BI is used primarily by non-technical users like Business heads, Finance heads or CEO’s etc.
  • Data Analytics is used by Data Scientists, computer programmers etc.

Clean vs Slightly Messy

  • BI makes use of highly organised dashboards and reports to derive insights.
  • Data Analytics involves data mining, making of algorithms, data modelling and more.

Curious about a career in Data Analytics?

If you’re curious about a career in Data Analytics, upGrad Campus has got the perfect stepping stone that can help you cross over to the world of Data Analytics! Check out our Data Science and Analytics course. With our course you’ll get hands-on experience with Python, Kaggle, SQL, Excel and Tableau. If you want to know more about our course you can head over to our website and get in touch with our learning consultants for a free career consultation!

Conclusion

Conclusion

To sum this entire article up, remember this – Business Intelligence and Analytics are used to help businesses – Data Analytics on its own is used by all industries and does not use business intelligence. The terms are often used interchangeably because some of the techniques used overlap. But the key difference is the purpose these two analytical methods are used and which industry they’re being used by.

Learning Python for Data Science and It’s Uses

Data Science has become vital for most industries to drive their growth ahead. From making better business decisions to predicting the outcome of certain financial or marketing choices, Data Science is used extensively by companies. But Data Scientists do not do this alone. They are armed with a plethora of tools to make these accurate predictions. And among those several tools, you will find that most Data Scientists make use of one tool extensively –

Python.

Why is Python programming favoured? How do companies use Python in Data Science? How can you jump on this bandwagon? Read the article to answer these questions.

– Why should you learn Python for Data Science?

Why should you learn Python for Data Science?

As you know Python wasn’t the first programming language for Data Science that was preferred. For years scientists used a variety of different programming languages from Fortran to C++ and Java, and don’t get us wrong – these languages are still very much in use. 

So why should you learn Python as a Data Scientist? 

There are several reasons we could give you like, for example, Python’s Flexibility – Python allows you to explore and experiment creatively. Since Python is run free of templates or specific APIs, it is suitable for the development of any kind of application or website. 

Python is also known for its Simplicity. Since its syntax is relatively similar to English, it is very easy to understand and pick up for beginners. Data Scientists will find this especially useful, since most of them come from a statistical or mathematical background and are not that familiar with coding. 

While we are on the subject of Python’s attributes, we have to mention the large community of Python users. This is good news for any fresher, as they’ll have innumerable resources at their disposal. From online tutorials and books to conferences like PyCon, Python has created a large and welcoming community, with help available around every corner.

Finally, possibly the biggest advantage of using Python is the availability of numerous libraries.

A library in Python is a bunch of precompiled code that can be used for certain pre-decided purposes. So code for commonly occurring tasks, like data cleaning and data analysing, does not have to be written from scratch. You can just pick up these codes from libraries of Data Science using Python:

  • NumPy – A library that helps with large mathematical tasks
  • Pandas – One of the easiest libraries to use; it assists with data cleaning and analysing
  • Matplotlib – This Python library for Data Science is used in data visualisation tasks and helps to make dynamic scatterplots, line graphs and more 
  • Spicy – This library helps with scientific computing like linear algebra and other statistical tasks

There are a lot more libraries in Python that you could experiment with to simplify the coding process. But in order to fully utilise Python’s capabilities, you first need to master it.

Must-learn Python Basics for Data Science

Must-learn Python Basics for Data Science

Now that you know why you should learn Python programming for Data Science, let’s kickstart your learning journey by understanding this detailed roadmap.

Step 1: Python Fundamentals

You want to start by understanding the Python basics first, libraries and data structures. Since Python’s syntax is similar to English, it shouldn’t be too hard to pick up the language.

Step 2: Regular Expressions

Once you grasp the basics of the language, take your learning up a notch and learn about Regular Expressions. RegEx is a sequence of characters that form a search pattern. RegEx is handy when you work with a lot of text, since they make filters more specialised and tailored to your needs.

Step 3: Libraries

Now that you’re fluent in the language and confident in your skill, move on to learning how to use the vast number of Libraries Python hosts. Start with NumPy and pay close attention to learning NumPy arrays, this will set up a solid base for you.

Step 4: Data Visualisation

Data Science as a field requires a lot of data visualisation, so that is one skill you should keep in mind while learning Python. There are several libraries for Data Science you can master for this; Matplotlib, Seaborn, Plotly are some of the commonly known ones.

Step 5: Projects

Alongside your learning, keep a portfolio of projects ready. These will provide credible, quantifiable proof of the things you have learnt and your expertise in the field. You can add the following projects to your portfolio:

Data Cleaning project

You would be surprised by how much raw data you can find on the internet. You can download this data and practice filtering it.

Data Visualisation Project

Data that is unreadable is of no use. Which is why making striking visuals is an important skill to possess. If your portfolio contains great-looking and comprehensible visualisations it will stand out.

Machine Learning

As a Data Scientist, you will work extensively with machine learning. It is basically the core requirement for being a Data Scientist. Working with different algorithms will give you an edge over your peers.

To delve deeper into Python for Data Science, let’s look at all the possible ways it can be used by a Data Scientist.

Applications of Data Science using Python

Applications of Data Science using Python

Data Science and Data Analytics have slowly started to make their presence known amongst almost every industry today. Be it Healthcare, Oil or Retail, these skills are used to gain valuable insights to make better marketing and business decisions. 

Data is collected and refined into logical conclusions and strategies. There are many

tools available out there for data analysis. However most companies favour Python as it supports Object-Oriented Programming, Structured Programming as well as Functional Programming. 

So what is Python used for?

  • Libraries like Pandas or NumPy help process large volumes of unfiltered data.
  • Sometimes data has to be scraped from the internet and is not readily available, so tools like Python Scrapy or Beautiful Soup can help with that. 
  • Next you need to make graphical representations of the data, no big deal – just use libraries like Matplotlib or Seaborn to make comprehensible graphs and visualisations.
  • Lastly, comes Machine Learning. ML is filled with complicated computational techniques, but Python is well equipped with Scikit-Learn for data classification, regression, clustering and more. 

Data analysis can also be performed using Python when it comes to data presented in images. It has a great open-source library called Opencv that deals exclusively with images.

Conclusion

Conclusion

By now you should’ve familiarised yourself with all the tools and attributes of Python for Data Science. We spoke time and again about how easy Data Science with Python is to learn. However, Data Science on its own is a complicated field that students need thorough guidance for.

If you want to kickstart your journey in Data Science, upGrad Campus offers a holistic Data Science and Analytics course. One of the many things you will learn in this course is Python programming from scratch with specific use cases in Data Science. Our course also gives you the chance to build an impressive portfolio with multiple projects spanning from data cleaning and data manipulation to data visualisation.

If you found this blog helpful, leave a comment below and let us know which topics you’d like us to cover next.

Data Analytics versus Big Data versus Data Science

Information is only useful when it’s understood.

This quote has become an emotion in this new era of business, where technology acted as a game-changer. In this day and age where anything can be considered as data and one man’s trash is another man’s gold, how do you navigate your company to higher prospects?

To make data usable it has to first be sifted through and made relevant.

That task is taken up by a talented Analyst. 

What is Data Analytics?

What is Data Analytics?

Data analytics is an umbrella term that encompasses many different types of analysis. Data can be subjected to various kinds of analytic techniques and tools to refine it and make it useful information. Think of data as crude oil. It’s valuable only because of what it can be converted into. Data analysis is the refinery that separates information from crude data. And just like refineries don’t run themselves, you need specialised people – called data analysts- who are responsible for gaining key insights from the refined information given to them.

Data Analytics can be useful to any industry, it all depends on what the company is looking to improve. Several sectors that have a high turnover, like medical, hospitality, travel, etc, use customer data such as personal information, reviews, complaints, compliments, guest preferences, review forms, etc, to fix or make improvements to existing protocols. Data Analytics in retails helps keep track of the latest trends, bestselling products, and the average spending power of customers, which helps retailers stay afloat in a vastly competitive field. In healthcare, copious amounts of structured and unstructured data, which include past patient records, are refined to make informed and quick decisions.

The goal of Data Analytics in any sector is to make enlightened decisions based on past records, behaviours, patterns, trends, preferences, and any kind of relevant information from the data pool.

So how is Data Analytics any different from Data Science or Big Data? 

All three of these terms share certain similarities. They all use the data available around us to improve decision-making and provide key insights for the company.

But the difference emerges in how they derive these insights and what they use to derive them.

To better comprehend how these 3 are different let’s review Big Data and Data science once.

Big Data Analytics: A revolution in data management.

Big Data Analytics: A revolution in data management.

Big Data, just like the name symbolises, deals with data in colossal quantities. Where traditional data sets are mostly in gigabytes or terabytes at most, big data comes in petabytes, zettabytes, or exabytes.

To put this into perspective, if one byte is equal to one metre, then 1GB of data is 1Million kilometres. That is the value traditional datasets work with. 1 petabyte is 1 billion Gigabytes. That is 1000,000,000,000,000,000 metres or bytes. Traditional storage systems are ill-equipped to handle a data set of this size. Big Data is most often stored on the cloud or needs a specialised storage solution depending on where the data is currently residing.

Big Data is differentiated based on these three components:

Volume, as discussed above, means the size of each data set.

Velocity is the speed at which data is derived. The reason Big Data is as big as it is, is because data is constantly generated.

Variety refers to the various sources from which data is collected. Big Data considers data present in texts, comments, likes, etc.

Due to the large volume and various sources of data, Big Data is mostly unstructured in nature and needs a different set of tools to be analysed.

Data Science - A step further from analytics.

Data Science – A step further from analytics. 

Now that we’ve taken cognisance of Big Data and Data Analytics, let’s delve into Data Science. Data science is a multifaceted field, involving extracting information from:

  • Scientific methods,
  • Maths and statistics
  • Programming 
  • Advanced analytics
  • Machine Learning
  • Artificial Intelligence
  • and Deep Learning

Since the scope of Data Science far exceeds its purpose, i.e, to gain meaningful insights, Data Science deals with analysing complex data, creating new analytics algorithms, tools to further distil the data and even building dynamic visualisations.

Ultimately, there is definitely a degree of truth to the saying data is the new oil.

We have yet to determine the true potential of using data and as we continue our discovery of the subject, the value of data is only going to grow exponentially. This in turn implies that the sectors that discern data are going to become integral to the growth of businesses across continents.

Data Science: Your ticket to a high paying job as a fresher

When Iron Man wasn’t suiting up in his den, he’d keep up a lively conversation with F.R.I.D.A.Y, flicking a chart here, expanding a graph there, and coming up with a brilliant solution to an end-of-the-world problem. In that one moment, he was being a data scientist – correlating huge volumes of information to make a decision.

There’s a good reason why Harvard, way back in 2012, called Data Scientist, the sexiest job of the 21st century. And it still holds true! Imagine sitting on a wealth of information and being able to see a picture that nobody else could. 

But getting there takes a while. And that’s why, if you’re enamoured by this role, you should consider upskilling as early as you can.

But what exactly is Data Science?

But what exactly is Data Science?

Considering how large and complex the digital data universe is, it’s difficult to come up with a precise definition of a Data Scientist.

Broadly speaking, data scientists organise and interpret data, and specialise in one of the below aspects:

  • Advanced Analytics –  Be it in supply chain, IoT, healthcare or finance, Advanced Analytics plays a critical role in understanding customers. Advanced Analytics predicts patterns in customer behaviour, forecasting the likelihood of future events and allowing organisations with better decision making. 
  • Cyber Security- Anyone who has watched any series based on the 21st century, understands what Cyber Security is. But less is known about Data Science’s role in the same. When data science – specifically machine learning – is applied to cyber security, organisations are able to detect loopholes in their digital environment. Data Science also processes vast amounts of data to understand the behaviour of an attacker.
  • Data Mining – Data mining is like any other form of mining. It involves cleaning, selecting and transforming – but the object that gets mined is data. Data mining is used to solve specific business problems like recognising fraudulent actions, supporting R&D processes, discovering relationships between customers and services, and more.
  • Data Visualisation – As the name suggests, it is the process of visual representation of data and relationships. If you’re only thinking of pie charts and graphs, think harder. From box-and-whisker plots to choropleth maps, there’s a world of figures out there to visualise data and bring to light hidden correlations between various activities in business.

As you can see, these fields also overlap in many principles, and the common ground is the ability to understand and interpret data. No matter what specialisation you choose, or if you choose more than one, there are many exciting opportunities in front of you.

Scope of Entry-level Data Science Jobs

Clearly, Data Science is the stuff of big guns. So to do well, you need either a Bachelor’s Degree in this field or some work experience. If you don’t have any of these, you’d definitely need a certification in Data Science that covers Python, SQL and Machine Learning.

Scope of Entry-level Data Science Jobs

Once you have these skills, here are some positions you should look for if you have specialised knowledge of Data Science

  • Business Analyst: A business analyst interfaces with internal departments to collect, distribute and manage organisational data. This responsibility can also expand to analysing requirements, documentation of processes, user acceptance testing and more.
  • Data Analyst: Starting from collecting and storing data, a data analyst must apply technical expertise to ensure the accuracy and quality of the data and come up with actionable insights. It’s a must for data analysts to have an eye for detail, a knack for scouring through data and putting the pieces together to form the big picture.
  • Data Engineer: A data engineer applies machine learning techniques and develops algorithms to convert raw data into actionable information. Considering every business has its own type of information and setup, a data engineer fills in a key position to meet the specific data needs of an organisation.
  • Data Generalist: Domain-agnostic by nature, a data generalist conducts an in-depth analysis of the organisation’s information systems, extracts insights from data and communicates them to business leaders. As they never deep dive into a specific vertical, a data generalist needs to have expertise in exploratory data analysis tools, scripting and modelling, data visualisation, etc.
  • Business Intelligence Developer: A regular engineering position – the role of a Business Intelligence Developer is to interpret and present organisational data using business intelligence technology. Developing a BI interface needs an understanding of software, databases, data analysis and some level of industry-specific knowledge.
  • Machine Learning Engineer: Another true-to-form technical position, machine learning engineers develop ML algorithms that analyse huge volumes of unstructured data and turn them into useful information. Text-to-speech conversions, meaningful auto-recommendations and self-running AI systems are some of the cutting-edge missions on the plate of a machine learning engineer.

These are but a few of the roles available in a career in Data Science. As organisations are unearthing the importance and the complexity of data, more domain-specific, function-specific and technology-specific roles are coming up, even as you are reading this.

Paygrade of Data Scientist

Paygrade of Data Scientist

Being a vast and yet potentially untapped field, the pay range for a Data Scientist is as varied as the responsibilities they are able to fulfil. The more cross-skilling a Data Science professional is willing to do, the higher the pay they are assured.

In India, a Data Science professional, at an entry-level, can expect a minimum of ~ Rs. 3.5 lakhs and an average salary of Rs. 7 lakhs. Most MNCs, large organisations and even some startups offer a data science professional, without any field experience, a package of Rs. 5 lakhs, provided they know their stuff. In just 3 to 5 years of work experience, this number can raise up to Rs. 14-20 lakhs per annum.

The easiest way to fast-track this journey is by upskilling the right way – which involves not only training in technology, industry trends and emerging tools, but also how these aspects can be applied to real-world problems. Explore upGrad Campus’s industry-ready course in Data Science and Artificial Intelligence to know more about the career opportunities in this field.

Best data analytics online courses in 2021

With the advancement of technology, there is abundant data that needs to be managed by the organization to get the maximum benefit in business. Data analysis has become the core competency of any success-oriented company. To excel in the field and get competitive advantages, an organization has to take the help of data analytics to make strategic decisions. In today’s scenario, every organization needs to collect, preserve, and analyze their data for improving business and gaining a competitive advantage. So, for skilled data analytics professionals, there is an ocean of opportunities across industries and to become skilled in this field one needs to enrol in Data analytics online courses.

Data Analytics Online Courses 

With such a huge volume of data, the role of data analytics has become more important in the organizational scenario. A data analytics course helps you to acquire the right skill set and knowledge that can open up new avenues and opportunities. Data analytics courses for beginners are designed with industry-relevant curriculum and case studies, which provides the beginners with valuable skills and expertise to serve the industry. Many basic data analytics courses for beginners focus on providing knowledge about the basic tools and software used in data analytics courses. 

Best Data Analytics Courses

Best data analytics courses focus on developing the ability to transform data into business insights for impactful decision making. The courses help to build the capability in business intelligence tools and their practical applications across multiple domains, to gain effective data-driven problem-solving skills. 

upGrad Campus, Coursera etc are some top online platforms that offer data analytics online courses. These data analytics courses are suitable for freshers, working professionals as well as entrepreneurs interested in building a strong foundation in modern business practices using an advanced analytical approach. The data analytics online courses cover job-relevant topics through an applied learning model with live sessions by leading industry professionals. The course curriculum includes hands-on applied projects through an online platform, live virtual classrooms, and access to regular learning support. 

Some colleges and universities offer data analytics courses in India at bachelor’s and master’s levels. The programs available for Bachelors degree in data analytics are B.Tech (Data Science and Data Analytics), B.Sc with specialization in data analytics, M.Sc in Data Analytics or other degrees with data analytics as one of the specializations. Anyone interested in a career boost in data analytics can opt for data analytics certification. 

The following data analytics certification courses offer ample opportunities to aspiring candidates looking for a successful career in data analytics.

Google Data Analytics Certification is a professional certification course by Google which aims at giving a thorough understanding of practices and processes of data analytics in day-to-day jobs. 

Amazon Web Services (AWS) data analytics certification course provides knowledge on analytical tools and applications using cutting-edge technology and real-life projects. It offers the opportunity to professionals associated with AWS, having few years of experience.

Microsoft Certified Data Analysts Associate Course teaches about the need for business intelligence and the use of BI tools that are used by data analysts. It is of two types of course; online for free and instructor-led paid courses.

IBM Data Analytics Professional Certificate on Coursera aims at building proficiencies for using tools in various data analysis tasks. It’s a free enrollment course with a duration of 11 months at 3 hours/week. It is a beginner-level course and no prior experience is needed, except basic computer skills.

Data Analytics Courses Fees

The data analytics course fees for certification ranges between INR 12,000 to INR 22,000. The data analytics courses for beginners in India provide Bachelors’ degrees with specialization in data analytics and also diploma or PG diploma. The data analytics course fees vary between institutions and depend on the level of degree/certification provided. Given below are some of the data analytics courses offered by different institutes and their corresponding fees.

  • Diploma in Data Analytics (MDU Rohtak): INR 30,000
  • Post Graduate Diploma in Data Analytics (SPPU Pune): INR 20,000
  • BSc (Hons) Data Science & Analytics (Sharda University, Greater Noida): INR 92,000
  • BTech with Specialization in Big Data Analytics ( LPU Jalandhar): INR 2,40,000
  • BTech with Specialization in Big Data Analytics in association with IBM (PDM University): INR 1,35,000

Data Analytics Courses Syllabus

The data analytics course syllabus aims at developing knowledge on analytics tools and their applications across business functions. It helps to build a successful analytics capability that has a very important application in the organizational environment. The basic topics that form the part of the data analytics course syllabus are as follows: Data structure and algorithm, Statistical Analysis, Machine languages, Data Visualization, Marketing analytics, Supply chain Analytics, Forecasting Analytics, Relational Database Management.

Data Structures and AlgorithmsSupply Chain Analytics
Probability and StatisticsCustomer Analytics
Relational Database Management SystemsRetail Analytics
Business FundamentalsSocial Network Analysis
Text AnalyticsPricing Analytics
Data CollectionMarketing Analytics
Data VisualizationOptimization
Statistical AnalysisMachine Learning
Forecasting AnalyticsSimulation

The best data analytics courses build a strong foundation on how to solve real business problems using analytical tools. upGrad Campus courses help to develop an in-depth understanding of artificial intelligence, machine learning, and other things to strengthen data-driven decision-making in organizations. 

*The placement figures represent the number of students placed by upGrad. Past record is no guarantee of future job prospects. The success of job placement/interview opportunity depends on various factors including but not limited to the individual's performance in the program, the placement eligibility criteria, qualifications, experience, and efforts in seeking employment. Our organization makes no guarantees or representations regarding the level or timing of job placement/interview opportunity. Relevant terms and conditions will apply for any guarantee provided by upGrad.