In this technologically-driven landscape, data has emerged as the new currency. Companies across different sectors and industries are leveraging the power of data to get new insights, learn about concealed customer trends, and make smarter decisions. All of these help a business gain a competitive edge over their peers and promote growth and profitability.
This has led to a surge in demand for business analysts. Pursuing a business analytics course has thus become an important pathway to career growth, enhancing one’s CV, and offering professionals newer and more prosperous opportunities.
In this blog, we will examine five predominant ways in which business analytics courses are beneficial for professionals and essential for successful career growth.
Benefits of Learning From A Business Analytics Course
Let’s look at five pivotal benefits of signing up for a business analyst certification course and how it can be advantageous for professions as well as businesses.
1. Smarter Decision Making
Data has emerged as a valuable resource that encourages businesses to make smarter decisions through data-driven insights and trend predictions. A business analytics course allows students to garner the knowledge and skills required in important concepts such as data interpretation and data analysis.
This empowers them to become a more valuable asset for their company as they can process and analyse customer data to help formulate better corporate decisions that ultimately lead to a more profitable outcome.
2. Exposure to Predictive Modelling and Analytics Tools
Business analyst certification courses also benefit students vastly by introducing them to important industry concepts such as predictive modeling, data mining and probability statistics. These predictive instruments are crucial in today’s data-driven landscape as they help companies determine market trends and potential avenues for growth. Thus, business analytics courses help professionals prepare better and get well-versed with such computational tools.
3. Increasing Demand for Analytical Skills
The corporate marketplace has grown increasingly analytical in nature, with companies relying heavily on customer data to formulate in their approach. As the amount of data grows, those with the capability to reveal hidden trends will become increasingly essential for every business. Hence, professionals who can make sense of this wealth of data and transform that information into actionable insights gain a huge competitive advantage over other industry professionals.
4. Placement Opportunities
Business analyst courses with placements train students both theoretically and practically to cater to the increasing industry demand. While learning theory is important, nothing can replace practical hands-on experience. Because of this, several business analytics online courses have also started featuring placement opportunities and volunteer programs.
These programs allow students to participate in experiential learning and discover what life as a business analyst would entail. They get the opportunity to undertake case studies and work on real-life projects to enhance their skills. Additionally, it helps students bolster their resumes and opens up several new job prospects.
Business analytics courses also offer students lots of networking opportunities. For starters, these courses bring together students from a wide range of diverse backgrounds, sectors and industries. This presents a great chance for professionals to make connections, share their knowledge and experience, and exchange insights from different domains.
Furthermore, students can also leverage workshops, placements, and internships to network with industry titans, veterans and leaders, setting up a springboard to launch their own careers.
Unlock Career Opportunities Through Business Analytics Courses!
If you aspire to grow your career and open up new avenues for yourself, then it is important to excel in business analytics. An increasingly prevalent and in-demand field, business analytics can take you to your dream company.
To master business analytics, visit upGrad Campus and choose the course of your liking. Our business analyst certification courses cover the full breadth of the curriculum needed to excel in this field while also presenting you with several placement opportunities. Speak with our career experts today to find out more about our business analytics full course fees, scholarship options, eligibility criteria, prerequisites, and other important information.
In today’s world of modern business, the role of a Business Analyst has gained utmost importance. Business Analysts serve as a bridge between technical and non-technical stakeholders, driving the success of projects by analysing needs, providing insights, and facilitating effective decision-making.
If you’re aspiring to embark on a career as a Business Analyst, this step-by-step guide will highlight your path to success.
Understanding the Role and Importance of a Business Analyst
At its core, a Business Analyst is a problem solver, translating complex business requirements into actionable solutions. They act as interpreters, bridging the gap between stakeholders, end-users, and development teams.
The business analyst’s importance lies in its ability to ensure projects align with business objectives, leading to enhanced efficiency, productivity, and profitability.
Educational and Skill Prerequisites
To excel as a Business Analyst, a foundation of essential education and skills is crucial. A bachelor’s degree in fields such as Business Administration, Information Technology, or Management often acts as a stepping stone. However, skills such as critical thinking, problem-solving, and attention to detail are equally important.
Most Important Skills for a Business Analyst:
1. Analytical Thinking: Business Analysts dissect complex problems to extract valuable insights, which are crucial for informed decision-making.
2. Communication Proficiency: Effective communication is the backbone of a Business Analyst’s role. Clear articulation of requirements, ideas, and solutions is vital.
3. Technical Know-how: A solid understanding of technical concepts and tools enables Business Analysts to collaborate effectively with development teams.
Certifications and Continuous Learning
Certifications add credibility to your skillset and demonstrate your commitment to the profession. Consider enrolling in Business Analytics courses to enhance your expertise.
Industry-Specific Expertise
A successful Business Analyst is well-versed in industry-specific knowledge. Understanding industry trends, challenges, and best practices enables better analysis and solution formulation.
Developing In-Demand Industry Knowledge for Effective Analysis
1. Research: Continuously stay updated on industry trends by reading reports, attending seminars, and participating in webinars.
2. Networking: Engage with professionals and peers in your chosen industry to gain insights and broaden your perspective.
Mastering Tools and Technologies
Proficiency in tools and technologies amplifies your effectiveness as a Business Analyst. Tools like Microsoft Excel, Jira, and SQL are indispensable for data analysis, project management, and requirement documentation.
Proficiency in Tools and Technologies That Enhance Analysis
1. Microsoft Excel: A powerful tool for data manipulation and visualisation, aiding in informed decision-making.
2. Jira: Essential for project management and collaboration, facilitating seamless communication within teams.
Effective Communication and Stakeholder Management
Communication is the cornerstone of a Business Analyst’s role. Navigating complex stakeholder relationships demands tact, empathy, and active listening.
Communication Strategies for Successful Stakeholder Engagement
1. Active Listening: Understand stakeholder needs by attentively listening and asking probing questions.
2. Adaptability: Tailor your communication style to different stakeholders, whether technical experts or non-technical users.
Data-Driven Insights and Decision Making
Modern business thrives on data. Business Analysts derive valuable insights from data, enabling organisations to make informed decisions.
Leveraging Data to Drive Informed Business Decisions
1. Data Collection: Gather relevant data from various sources, ensuring accuracy and relevance.
2. Data Analysis: Utilise tools and techniques to uncover patterns, trends, and correlations in data.
Future Trends in Business Analysis
As technology evolves, so does the role of a Business Analyst. Embrace emerging trends such as Artificial Intelligence (AI), Machine Learning (ML), and Business Intelligence (BI) to stay relevant.
1. AI and ML Integration: Business Analysts will leverage AI and ML to analyse vast amounts of data and predict trends.
2. Automation: Robotic Process Automation (RPA) will streamline repetitive tasks, allowing analysts to focus on strategic analysis.
Conclusion
Becoming a proficient Business Analyst requires a combination of education, skills, certifications, and a commitment to lifelong learning. By mastering the art of effective communication, data analysis, and staying attuned to industry trends, you can position yourself as a valuable asset in the world of modern business.
As we mentioned above, The upGrad Campus Business Analyst course offers a comprehensive and industry-aligned program designed to equip aspiring analysts with essential skills. Through a blend of theoretical knowledge and practical application, students gain proficiency in data analysis, communication, stakeholder management, and more.
This course provides a platform to explore real-world case studies and collaborate with experienced mentors, preparing participants for the demands of the Business Analysis field.
In today’s data-driven world, businesses have access to an overwhelming amount of information. However, simply collecting data is not enough.
To gain valuable insights and make informed decisions, businesses need to be able to effectively analyse and communicate their data findings. This is where the power of Data Visualisation comes in.
Today Data Visualisation has become an indispensable tool for Business Analytics – so much so that it has become a cornerstone in every business analytics training program.
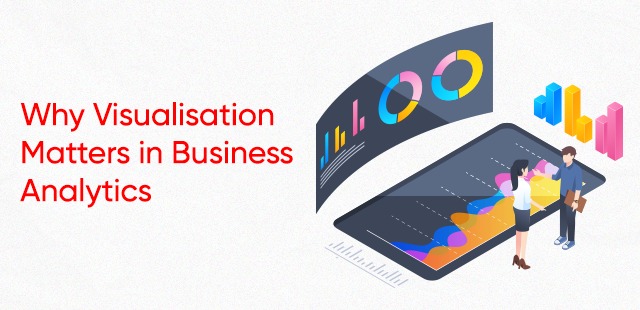
Why Visualisation Matters in Business Analytics
Data Visualisation allows businesses to understand and communicate complex information in a way that is easy to comprehend.
Raw data can be difficult to interpret, especially when there is a large amount of information. By transforming this data into visual representations, such as charts, graphs, and dashboards, business analysts can quickly and effectively communicate important insights and trends to decision-makers.
Visualisation also allows businesses to identify patterns and relationships that might be otherwise difficult to see. When data is presented in a visual format, it becomes easier to spot trends and patterns that may not be immediately apparent from the data itself. This can help businesses identify new opportunities, optimise operations, and make more informed decisions.
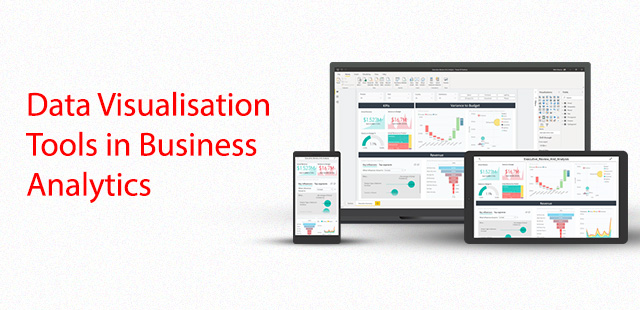
Data Visualisation Tools in Business Analytics
There are many Data Visualisation tools available that businesses can use for analytics. Here are some popular ones.
Tableau: Tableau is a powerful Data Visualisation tool that allows businesses to create interactive dashboards, reports, and charts. It is user-friendly and offers a variety of data connectors that make it easy to communicate with different data sources.
Power BI: Power BI is a business analytics service by Microsoft that provides interactive visualisations and business intelligence capabilities with an interface simple enough for end users to create their own reports and dashboards.
Google Data Studio: Google Data Studio is a free data visualisation tool that allows businesses to create interactive dashboards and reports using data from a variety of sources, including Google Analytics, Google Sheets, and Google AdWords.
Domo: Domo is a cloud-based platform that allows businesses to create real-time dashboards and reports, and collaborate with team members in real-time.
SAP Lumira: SAP Lumira is an analytics and data visualisation tool that allows businesses to create interactive dashboards and reports using data from a variety of sources, including SAP HANA and SAP BusinessObjects.
These are just a few examples of data visualisation tools that are suitable for businesses. The choice of tool depends on the specific needs and requirements of the business, as well as the data sources they are using.
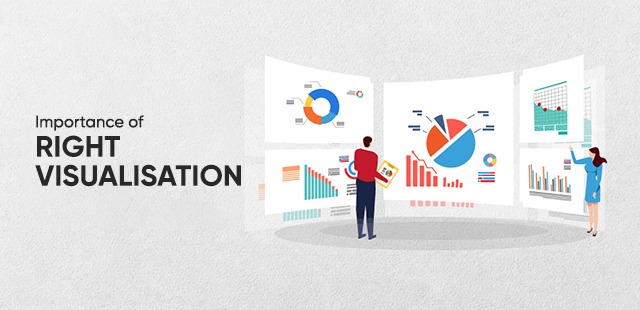
Importance of Right Visualisation
Choosing the right visualisation can make the difference between effectively communicating insights or confusing your audience.
The right visualisation can help you convey complex information in a clear and concise manner, allowing your audience to quickly understand and interpret your data.
There are several common types of visualisations used in data visualisation, including:
Bar charts: Bar charts are used to compare different categories of data. They display data as horizontal or vertical bars, with the length of the bar representing the value of the data.
Line charts: Line charts are used to show trends over time. They display data as a series of points connected by a line, with the position of the points representing the value of the data.
Scatter plots: Scatter plots are used to show the relationship between two variables. They display data as a series of points on a graph, with the position of the points representing the values of the two variables.
Pie charts: Pie charts are used to show how a whole is divided into different parts. They display data as a circle divided into slices, with the size of each slice representing the proportion of the data.
Heat maps: Heat maps are used to show the distribution of data values over a two-dimensional area. They display data as a grid of coloured squares, with the colour of each square representing the value of the data.
Tree maps: Tree maps are used to show hierarchical data structures. They display data as a series of nested rectangles, with the size of each rectangle representing the value of the data.
These are just a few examples of common types of visualisations used in data visualisation. The choice of visualisation depends on the type of data being analysed and the insights that need to be communicated.
Picking The Best Program for Your Journey
If the field of Business Analytics excites you and you see your future self excelling in this field, then here are some tips you can follow while choosing a Data Visualisation course.
To choose the right course, you should look for one that covers the following topics:
Understanding different data types: A good course will teach you how to identify the different types of data (e.g., categorical, continuous, etc.) and which visualisations are best suited for each type.
Identifying your goals: The course should cover how to determine what you want to communicate with your data and how to choose a visualisation that effectively communicates that message.
Considering your audience: A course on data visualisation should teach you how to consider your audience’s needs and level of data literacy when choosing a visualisation.
Evaluating different visualisations: The course should cover the advantages and disadvantages of different types of visualisations and how to choose the one that best suits your data and goals.
Testing and refining: Finally, a good course will teach you how to test your visualisations with your audience and adjust to improve their clarity and effectiveness.
By choosing a course that covers these topics, you can choose the right business analytics certification program.
Conclusion
Choosing the right business analytics certification program for your business analytics journey requires careful consideration of your career goals, course content, quality of instruction, mode of delivery, and industry recognition. By taking these factors into account, you can choose a course that will help you achieve your career goals and succeed in the field of business analytics.
Kickstart your business analytics journey with the upGrad Campus business analytics training program. With this program, learn how to tackle complex business problems using in-demand tools.
Business Analytics is a rapidly growing field that has revolutionised the market. It uses advanced techniques and tools to analyse and interpret data, uncover insights, and make informed business decisions.
As businesses increasingly rely on data-driven decision-making, the demand for business analyst courses is skyrocketing. With the help of more efficient and more innovative technologies and automation, this field is growing fast.
This blog will help you learn about the business analytics salary and job opportunities you can possess by enrolling in abusiness analytics online course.
Overview of Business Analytics
Business analytics is the foundation of data-driven decision-making. It entails systematically examining data to gain significant insights and support strategic decisions. Businesses can make informed decisions, optimise operations, and forecast future trends by analysing historical and real-time data.
In today’s data-rich setting, data analytics is a tool that incorporates across industries. Applications range from retail and finance to healthcare and industry. With the emergence of advanced analytics tools and machine learning, analysing data has become all the more critical, allowing firms to acquire a competitive advantage and respond quickly to dynamic market situations.
As a result, there is a high demand for business analysts and data analysts who enable enterprises to make informed decisions, optimise operations, and gain competitive advantages.
Key Factors Influencing Strong Business Analytics Job Prospects
Business analyticscareer opportunities are expected to remain robust and will continue to expand as the relevance of data-driven decision-making rises. Here are the significant factors to consider when enrolling for a business analytics online course.
1. Expanding Data Universe
As data from many sources, such as social media, loT devices, and online transactions, increase, there is a significant need for individuals to evaluate and draw meaningful insights from the data.
2. Industry-wide Interest
Business analyticsabilities are helpful in various industries, including banking, healthcare, retail, e-commerce, and manufacturing. Due to their adaptability, business analysts have many career prospects.
3. Adopting New Technologies
Inception of new technologies such as AI, machine learning, and big data analytics has increased the demand for skilled analysts who can use these tools to provide significant insights.
4. Remote Employment and Global Opportunities
The Covid-19 epidemic has hastened the use of remote opportunities. This trend has widened business analyst’s career opportunities, allowing them to work for firms worldwide.
The salary for a fresherwho is currenting pursuing a business analytics certification course in India can vary depending on several factors. Let’s uncover these factors to help you make informed decisions.
1. Rising Salaries
Organisations are willing to pay competitive prices to attract and retain top individuals as the importance of data analytics grows. On average, a business analyticsprofessional can expect to earn between Rs. 4,00,000 to Rs. 15,00,000 per year in India.
2. Experience Counts
Experience is one of the main factors determining your salary as a business analyst. Based on your experiences, below is the average base salary you can expect in India:
Entry Level Business Analyst – Rs 3,69,525
Early-Career Business Analyst – Rs 5,13,065
Mid-Career Business Analyst – Rs 8,56,871
Late-Career Business Analyst – Rs 12,89,367
Experienced Business Analyst – Rs 19,65,270
You will get better as you gain more experience working with different organisations.
3. Influence of Location
In India, the annual salary of a business analyst differs based on the city. To give you a better idea, here is a list of cities and the salary you can expect as a business analyst:
Bangalore – Rs 7,38,092
New Delhi – Rs 6,08,820
Pune – Rs 7,52,994
Mumbai – Rs 6,19,360
Hyderabad – Rs 6,38,815
Kolkata – Rs 6,81,163
This is an average annual salary for each city, and it may differ depending on your skills and experience.
4. Industry Variance
The industry in which you work can have a huge impact on your compensation. Here’s a comprehensive list of the annual salary you might anticipate as a business analyst, depending on your sector:
IT Consulting and Services – Rs 7,00,000
Financial Services – Rs 8,10,000
Manufacturing – Rs 7,00,000
Hardware and Networking – Rs 7,30,000
Internet – Rs 8,40,000
As per the recent update, the average yearly income for a Business Analyst in India is Rs. 10,65,000, with extra incentives that range from Rs. 50,000 to 2,00,000.
Business Analytics Salary and Job Outlook: Charting Your Path to a Brighter Future Career
The future of business analyst professionals holds great potential as industries increasingly recognise the pivotal role of data-driven decision-making. The offering of competitive salaries and benefits reflects the substantial demand for skilled analysts.
An effective strategy to build a career inbusiness analytics is to enroll in a business analyst certification course. You can anticipate greater job security, higher salary potential, and the prospect of assuming leadership roles within analytics departments.Visit upGrad Campus to explore the comprehensive business analyst courses available and embark on your journey toward a successful career in business analytics.
FAQs
1. Is business analytics a high paying job?
Yes, business analytics is a well-paying profession. Salaries vary depending on criteria such as experience, location, and industry, but usually competitive income.
2. What is the salary after a business analytics course?
After completing a business analytics course, your pay will vary significantly on various factors, such as your previous experience and the particular role you land. Entry level, however, can get around Rs. 4-7 lakhs annually on average, with experienced professionals getting significantly more.
3. Is business analytics an in demand job?
Yes, there is a significant demand for business analytics. Organisations rely on data to make informed decisions, necessitating a continuing need for competent analysts to extract valuable insights from data and drive corporate growth.
4. Is a business analyst a stressful job?
Yes, there is a significant demand for business analytics. Organisations rely on data to make informed decisions, necessitating a continuing need for competent analysts to extract valuable insights from data and drive corporate growth. Hence, it’s all the more important that your foundation is set correctly.
5. Does business analyst require coding?
Business analysts merely require substantial coding knowledge. However, for data processing and analysis activities, having a rudimentary understanding of coding, particularly in languages such as SQL or Python, could be advantageous. The specific coding requirements for each position and firm can differ.
Nowadays, Business Analytics is a powerful way to make business growth decisions and form business strategies and plans. As different industries gather lots of data, the necessity for skilled professionals who are able to understand and assess this data has increased significantly.
A study by MicroStrategy reveals that worldwide companies are utilizing Business Analytics to bolster efficiency (64%) and decision-making (56%), and realize better financial performance (51%). Additionally, the research demonstrates that nearly two-thirds of global organizations are expecting to expand analytics spending.
Gaining an in-depth understanding of Business Analytics can open the door to career advancement and better decision-making in the workplace. Suppose, a discussion is going on at your workplace or college and few people have their ideas, but you have the data to support your ideas or opinions then it will be considered as on priority. So, before we dive into the benefits and advantages of Business Analytics, let’s try to figure out what “Business Analytics” basically means.
Business Analytics: A Brief Overview
Business Analytics is the use of quantitative methods to gain insights from data to inform business decisions. It involves four primary techniques:
Descriptive: This analysis looks at past data to identify trends and patterns.
Diagnostic: Through this technique, we can use the same data to examine why certain events occurred.
Predictive: This uses statistics to predict future outcomes.
Prescriptive: It applies techniques to determine the best outcome for a given situation.
These four methodologies can be employed either separately or together to evaluate past operations and improve future business results.
Difference Between Business Analytics & Data Science
Before we uncover more insights on the Business Analytics Certification Program, it’s important to differentiate it from data science because people often think that both of these terms are common – but it’s not. So, Let’s figure eachout!
Business Analytics and Data Science are two distinct, yet complementary approaches to working with data to solve business problems. Business Analytics typically involves examining data to reveal insights and facilitate decision-making, while Data Science applies algorithms and statistical models to uncover patterns and uncover previously unknown connections within raw data.
Both processes help organizations gain useful business insights for improving performance. With Business Analytics, companies can identify key trends, analyze customer behavior, and develop strategies to increase profits. Meanwhile, Data Science offers deeper insights, from uncovering new opportunities to improving cost savings. By taking advantage of the different approaches, companies can maximize their data-driven capabilities and drive meaningful change.
Advantages of Business Analytics
– Smooth Decision-Making
Business Analytics can provide a valuable resource for making informed decisions. An example of this can be seen with ride-hailing company Uber, who in early 2018 improved their Customer Obsession Ticket Assistant (COTA) with machine learning and natural language processing to help agents with speed and accuracy. To determine the effectiveness of the new version, Uber used prescriptive analytics and A/B testing which revealed that the updated product led to faster service, better resolution recommendations, and higher customer satisfaction scores. As a result, Uber saved millions of dollars, demonstrating the potential benefits of Business Analytics.
– Increased Profitability
Business Analytics can provide powerful benefits, such as an increase in revenue and savings in costs. A McKinsey study found that organizations that invest in data and analytics can realistically expect an average six percent increase in profits over the course of five years. Similarly, a research from BARC indicated that businesses leveraging analytics saw an average 8% percent boost in revenue, along with a 10% decrease in costs.
– Increased Operational Efficiency
The use of business analytics offers significant advantages, including improved operational efficiency. According to a KPMG report on the latest infrastructure trends, many companies are relying on predictive analytics to spot potential maintenance and operational problems before they worsen. An example of this is a mobile network operator that leveraged data to forecast outages seven days in advance. This allows the firm to minimize operational costs, as well as improve asset performance, by optimizing their maintenance processes.
Importance of Studying Business Analytics
Studying Business Analytics can be immensely beneficial when looking to take a data-driven approach to business. According to LinkedIn, Business Analysis is one of the top skills that companies need most in 2020. The Bureau of Labor Statistics also predicts an increase of 23 percent in operations research analyst jobs from 2020 to 2031, which is faster than the average for occupations. By studying Business Analytics, professionals can learn how to interpret data findings in relation to their business-related processes.
Some people may be good at crunching numbers, but it’s those who can interpret the data in the context of the business that will thrive in our ever-changing world.
Certification Program in Business Analytics by upGrad Campus
Employing data is essential for keeping up with the competition; failure to do so will result in you lagging behind in your career. People with the right abilities and knowledge of business operations will be the ones who have the most influence and deliver the greatest outcomes.
If you’re interested in capitalizing on the need for data-minded professionals, taking an online Certification in business analyst course is one way to broaden your analytical skill set and take your career to the next level.
Identify patterns, develop hypotheses and draw conclusions from population data to create an analytical structure that can be used to support everyday decision-making and enhance the success of your organization.
Key Highlights of the Business Analyst Course
– 4.5 Month Duration
– Live and Recorded Sessions
– 300+ Hiring Partners
– Guaranteed Certification
Conclusion
Harness the potential of data within your organization to maximize success.
Discover our 18-week Online Course in Business Analytics to gain insight into how data analysis can be used to address business challenges.
In today’s frenzied technological landscape, data is more valuable than gold! Data-driven decisions help build business acumen and play a pivotal role in a company’s success. The dynamic and transformative realm of Big Data has produced the niche field of Business Analytics. This field is a subset of the umbrella field of Data Analytics, and helps unlock invaluable insights that can help a company grow and increase in profitability.
Because of how valuable this field has become, companies are always on the lookout for professionals with business analyst training. Freshers can leverage this emerging sunrise sector by enrolling inbusiness analyst courses to enhance their skills and secure a prosperous future. Business analyst certificationcan go a long way in helping students have a successful career and make them industry leaders in this domain.
This blog will serve as a definitive guide on business analytics. It will help demystify this fascinating domain and explain why it is so revolutionary for brands and industries alike. Let’s embark on this delightful journey together.
What are the benefits of Business Analytics?
As we mentioned, Business Analytics is the process of gaining key insights using data, to make informed business decisions. Business Analysts help businesses refine historical data to find important facts. These insights can predict future trends and patterns that help the company make better decisions when it comes to investing in any venture. These insights help companies understand their customers better, and meet their demands. Further, Business Analytics helps companies boost profits and increase market share.
Putting it simply, Business analysts look at the past to make better decisions for the future.
Business Analysts use 2 main types of analysis to achieve this – Descriptive Analysis and Predictive Analysis.
Descriptive Analysis involves studying historical data and past patterns to understand why a certain trend worked or why something didn’t work.
Predictive Analysis uses the collated refined data to make future predictions, or basically to make business forecasts and set up budgets for the near future.
For businesses, this is a very vital need. Large volumes of data and crucial insights in an understandable and readable form can make or break the business.
Commonly used Business Analytics Tools
These are the commonly used analytical tools by Business Analysts.
SAS Business Analytics (SAS BA)
SAS stands for Statistical Analysis System. SAS is a software suite made for Data Management, Business Intelligence, Predictive Analysis and Descriptive Analysis.
QlikView
QlikView is a relational data analytics and BI solution for understanding and gaining insights from complex datasets. QlikView is used by companies like Mercedes Benz, Cognizant, TCS and more.
Board
Board, as the name suggests, is a management software. From scheduling meetings to sharing documents and minutes, the Board management software was made to streamline SOPs, ensure no oversights and make sure best practices are followed.
Splunk
Splunk is used for scanning and searching through Big data. It allows users to search, analyse and visualise the data gathered from many places like websites, applications, sensors, devices etc.
Sisense
Sisense is also a BI platform. Its users mainly use it to query databases, create data models and create dashboards from those data models, etc.
Microstrategy
MicroStrategy is a cloud-based business intelligence platform that helps with both data mining and visualisation.
KNIME
KNIME Analytics Platform is an open source software that, without any coding, allows users to access, blend, analyse, and visualise data.
Tableau
Tableau manages vast volumes of data and turns data into valuable insights. Since Tableau is used by almost every industry today, it has become one of the basic requirements recruiters look for in Business Analysts.
Excel
Excel might be one of the oldest tools in the industry, however, it is still the popular analytical tool across all industries. Excel is a powerhouse of features that allows you to:
Collect data
Perform statistical analysis
Make complex reports
Integrate with other Business Intelligence tools like Power BI
Power BI
Power BI is mostly used for data visualisation. It contains standard data visuals that you can utilise to build interactive reports, such as bar, column, line, map, matrix, pie charts, scatter, table and waterfall.
If you want to know more about Business Analysts tools in the market, headover to this blog!
How Business Analytics works
The goal of business analytics is to make sense of data and use it to make better business decisions. It is the process of gathering information from multiple sources, such as sales numbers, customer interactions, and market trends. Analysts can then find patterns, make forecasts, and discover new opportunities by employing tools such as statistical models and data visualisation.
A retail organisation, for example, might employ business analytics to examine sales data and customer behaviour. They might learn which products are doing well, which aren’t, and why. This data can then be used to make educated choices about inventory management, marketing strategies, and shop layout.
In brief, Business Analytics assists organisations in transforming data into actionable insights, allowing them to make better decisions and stay ahead of the competition.
Business analytics vs. Business Intelligence
BI refers to the tools and procedures that businesses use to collect and manage data, and then present it in a meaningful and understandable manner. The purpose of BI is to offer executives and decision-makers with a full and accurate picture of the business so that they can make educated decisions.
BA, on the other hand, digs further into the material collected by BI. It is about evaluating the data and generating insights that might help businesses make better decisions. It’s all about transforming raw data into valuable information that can be utilised to enhance business outcomes.
In simpler terms, there isn’t much of a difference between Business Intelligence and Business Analytics, except that BI provides you with the ‘what’ and ‘when’ of your business, whereas BA offers you the ‘why’ and ‘how’.
Data Analytics and Business Analytics are both concerned with the analysis of data. There is, however, a difference between Data Analytics and Business Analytics.
Data Analytics is a larger term for the process of analysing raw data to get insights and conclusions. It may be applied to any type of data and utilised for a wide range of applications, including scientific research, market research, and even personal data analysis.
Business Analytics, on the other hand, is a subset of data analytics that focuses on the analysis of one organisation’s data. Business analytics’ purpose is to use data to improve business performance and make sound business decisions. Data for Business Analytics looks something like this, sales figures, consumer data and company data. Business analytics uses data specific to one organisation.
For example, one company’s consumer data, and financial data, as collected and refined, in order to assist management in making better decisions.
Data Science is a vast field of study that involves gaining insights and usable information from data by using various tools and techniques. Some of these are statistical analysis, machine learning, and building predictive models. The goal of Data Science is to find or predict patterns, relationships and trends in data to drive innovation.
Business Analytics, as we discussed, is a more specific application of analysis. It focuses on the data of one business. Business Analytics is often attentive towards key performance indicators (KPIs) and metrics that are important to a specific business, such as sales, marketing, and customer behaviour.
Common Challenges of Business Analytics
Since Business Analytics is still a growing field, Business Analysts often end up facing certain difficulties with their work (just like any other industry), some examples include:
Lack of Skilled Resources: It might be challenging to find people with the necessary abilities, skills and understanding to manage big data analytics.
Gaining Big Data Insights: Working with big volumes of data may be intimidating, and extracting useful insights without experience or appropriate tools can be difficult.
Bringing Data to Big Data Platforms: Integrating different data sources and translating them into an analytical format may be a time-consuming procedure.
Data Management Landscape Uncertainty: Because the field of big data analytics is continually expanding, it can be difficult for Business Analysts to remain up to date on the newest technology and best practices.
Data Storage and Fast Retrieval: Storing and rapidly accessing vast volumes of data can cause a hindrance in a Business Analyst’s job, if the data infrastructure is not up to date.
Roles and Responsibilities of a Business Analysts
By now we’ve understood the importance of Business Analysts, but let’s dive deeper into what their day-to-day responsibilities include:
Finding problems in the organisation, identifying opportunities, providing use cases for solutions and documenting them in a detailed business analysis
Budgeting and forecasting using historical data to make predictions about future trends.
Monitoring progress on various business initiatives that have been taken by the company
Variance Analysis, which is basically finding the difference between the forecasted budgets and actual numbers. This helps to improve accuracy in the future.
Defining business needs to the various stakeholders involved
And understanding Key performance indicators for any business and keeping track of how they perform.
This sounds like a lot. And believe us, some Business Analysts do a lot more than this. But this usually depends upon the organisation you work for and their requirements.
Why is data driven analytics of interest to companies
Data-driven insights are required for businesses to make educated decisions, increase operational efficiency, and gain a competitive advantage. With organisations producing a rising quantity of data, it is becoming increasingly critical to harness this data to produce better outcomes.
Data-driven insights may assist businesses in the following ways:
Improve decision-making: By analysing data, businesses may uncover trends, patterns, and linkages that can help them make better decisions.
Improve operational efficiency: By examining operational data, businesses may discover areas for improvement and optimise procedures to boost efficiency.
Gain a competitive advantage: Companies that embrace data-driven insights can outperform those that rely on intuition or guesswork.
As the demand for data-driven decision making grows, the future scope of Business Analytics seems promising. As businesses create more data, the demand for individuals who can interpret that data will only grow. Furthermore, technological advancements such as artificial intelligence and machine learning will continue to alter the field of Business Analytics and open up new prospects for experts.
Conclusion
In conclusion, Business Analytics is a rapidly expanding field with considerable opportunities for firms seeking to use data to improve results and achieve a competitive edge. The biggest takeaway from this guide is the incredible potential of business analytics. There are significant opportunities for students in this domain as more and more firms understand the power of data. If you’re interested and want to take your skills to the next level, explore our dynamic Business Analytics Certification Program. It is a business analyst course with placement opportunities so that freshers who wish to gain practical experience to supplement their theoretical knowledge can benefit from it. We cover a wide range of tools and techniques for Business Analytics (from Forecasting, A/B testing to Excel, Tableau, among others). Embrace the power of Big Data and let analytics guide you to a prosperous and successful career!
A: Business analytics involves the process of gathering, analysing, and interpreting customer data to help companies make well-informed business decisions. It entails using data-driven insights to navigate complex corporate problems, enhance operating efficiency and increase overall business profitability.
2. What is the main purpose of business analytics?
A: The predominant aim of business analytics is to improve organisations. It helps companies make data-driven decisions that augment efficiency and growth by helping them to identify hidden trends and patterns. It allows them to exploit opportunities within customer data and thus help them plan more strategically, placing them ahead of their competitors.
3. What are the four types of business analytics?
A:Business analytics can be categorised into four main types – Descriptive Analytics, Diagnostic Analytics, Predictive Analytics and Prescriptive Analytics. Each has their own strengths and can be leveraged to help organisations grow.
4. Is business analytics a STEM course?
A: Yes, business analytics falls under the STEM (Science, Technology, Engineering, and Mathematics) discipline. This is because it combines statistics, data analysis, and technology with mathematical concepts to produce data-driven insights. Having a strong foundation in these fields before you enroll in a business analyst course can be quite helpful.
5. What is the future of business analysts?
A: The future of business analytics looks very promising. While the field is still in its infancy in India, businesses have already recognised its potential. They are increasingly relying on data to drive better decision-making, and thus, the demand for skilled professionals who have undergone business analyst training is also rising.
Data driven industries often throw around the words Business Intelligence and Data Analytics, but as someone new to the industry do you truly know the difference between these terms?
In today’s Blog we’re going to work out the differences between the two and once and for all settle the debate as to which is better – Business Intelligence or Data Science?
Starting with what is BI?
What is Business Intelligence?
To explain this simply, we can split the definition of Business Intelligence into 2 parts:
The processes, tools, technologies used to gain valuable business insights from large amounts from raw data.
The output of the process – the business insights themselves. Going forward let’s keep both the processes and the outcomes in mind when we talk about Business Intelligence.
When we talk about processes, we’re referring to the conversion of raw data into meaningful business insights. These are the techniques in order to achieve that:
Real-time monitoring
Dashboard development and reporting
Benchmarking
Implementation BI software, like Power BI
Performance management
Data and Text mining
How does Business Intelligence work?
We all know that in simple terms BI takes raw data and converts it into meaningful information, but how exactly is that achieved? Let’s take the above mentioned processes and explore them a little more.
Real-time monitoring – It is the process of collecting and storing performance metrics (the set parameters tell you how well your campaign is doing) as and when it crosses your network.
Dashboard development and reporting – A Dashboard portrays your data in the form of graphs, charts, etc. All your data is presented together visually, making it easy for you to catch-up faster.
Benchmarking – It is the process of comparing the metrics you collected with the numbers present in the industry.
Implementation of BI software – Softwares and tools like Power BI, SQL etc, will help you collect, clean and present data in the form of powerful visuals.
Performance Management – The process of ensuring that certain goals at the start of a campaign are met.
Data and Text Mining – It is the process of discovering patterns and information from large data sets. It makes use of machine learning, statistical analysis and more.
Examples of Business Intelligence
So where is Business Intelligence used? (Just about everywhere)
Customer Interactions
BI can help you build a dashboard that shows you all customer interactions across all platforms. This can help you get a complete picture of the service you’re providing without having to manually go through every platform.
Website Traffic
Business Intelligence can help you effectively track website traffic.
What is Data Analytics?
Data Analytics is a process of collecting, cleaning, inspecting, transforming, storing and modelling. In truth you can say that Data Analytics is a tool used in Business Intelligence to make informed decisions, however Data Analytics is used in many many more fields to find valuable insights. Other than Businesses, Data Analytics is used by:
The Medical Industry
The Government
The Education System
Research
So what is the difference between Data Analytics and Business Intelligence? Let’s find out!
The differences between Business Intelligence and Data Analytics
To further elaborate on the broad differences between BI and Data Analytics, we have put together a list of different concepts or techniques the two use.
Using insights vs. creating insights
BI uses insights to make informed decisions.
Data Analytics, uses various analytical tools and techniques to to find these insights in the first place
Backward-looking vs. Forward-looking
Business Intelligence mainly focuses on looking at historical data to discover trends and make better decisions.
Data Analysis on the other hand, uses historical data to discover patterns and trends that can be used for forecasting or Predictive Analysis.
Structured vs. Unstructured data
Business Intelligence makes use of structured data, collected from data warehouses.
Data Analytics on the other hand, starts off with the process of cleaning, sorting and storing unstructured data.
Non-technical users vs. Technical users
BI is used primarily by non-technical users like Business heads, Finance heads or CEO’s etc.
Data Analytics is used by Data Scientists, computer programmers etc.
Clean vs Slightly Messy
BI makes use of highly organised dashboards and reports to derive insights.
Data Analytics involves data mining, making of algorithms, data modelling and more.
Curious about a career in Data Analytics?
If you’re curious about a career in Data Analytics, upGrad Campus has got the perfect stepping stone that can help you cross over to the world of Data Analytics! Check out our Data Science and Analytics course. With our course you’ll get hands-on experience with Python, Kaggle, SQL, Excel and Tableau. If you want to know more about our course you can head over to our website and get in touch with our learning consultants for a free career consultation!
Conclusion
To sum this entire article up, remember this – Business Intelligence and Analytics are used to help businesses – Data Analytics on its own is used by all industries and does not use business intelligence. The terms are often used interchangeably because some of the techniques used overlap. But the key difference is the purpose these two analytical methods are used and which industry they’re being used by.
In a nutshell Business analytics tools are application softwares that fetch data from one or more business systems and combine it in an archive to be reviewed and analyzed. Let’s take a look at what are the different tools used in Business Analytics.
1. SAS Business Analytics (SAS BA)
SAS stands for Statistical Analysis System. It is a software suite built for Data Management, Business Intelligence, Predictive Analysis and Descriptive Analysis. Since SAS can be used for so many different tasks, it is one the most popular tools for industry analysis.
Here are the most common industrial uses of SAS:
Stock Prediction
Clinical Research
Optimization
Fraud Detection
2. QlikView
QlikView is a relational data analytics and BI solution for making sense of complex, large datasets. It allows companies to build dashboards and data summary views that lets you see the company’s progress at a glance. The many benefits of this Data visualization platform include:
Easy to implement, since QuickView doesn’t necessarily pull data from Data warehouses or cubes.
One QlikView application can often replace hundreds of reports and the cubes used for them.
Makes use of In-memory technology that allows you to easily access data at any time.
QlikView is used by many famous companies like Mercedes Benz, Cognizant, TCS and more.
3. Board
Board is a management software. From scheduling meetings to sharing documents and minutes, the Board management software is designed to streamline processes, prevent oversights and ensure best practices are followed. The benefits of using this software include:
Being able to obtain information (like, strategic plans, policy manuals etc)
Increasing Board member engagement
Having control over who has how much access.
4. Splunk
Splunk is used for monitoring and searching through Big data. It allows users to search, analyze and visualize the data gathered from various sources like websites, applications, sensors, devices etc.
5. Sisense
Sisense is another really good BI platform. Its users mainly use it to query databases, create data models and create dashboards from those data models, etc. It is mainly used by the IT and Finance industries.
6. Microstrategy
The MicroStrategy analytics platform is a cloud-based business intelligence platform that supports both data mining and visualization. One of the great features of this platform is that it is scalable, so companies can start small on an as-per-need basis and then scale up to enterprise level deployment.
7. KNIME
KNIME Analytics Platform is an open source software that allows users to access, blend, analyze, and visualize data, without any coding. Since it’s not code-heavy at all, KNIME is a good platform for Data Analysts and Data Scientists.
8. Dundas BI
Dundas BI is a BI reporting tool that is known for creating enterprise-level dashboards and Data Visualization. Using Dundas you can make interactive dashboards, reports, scorecards and more.
9. TIBCO Spotfire
TIBCO Spotfire is an artificial intelligence based business intelligence platform. One of the many benefits of using TIBCO is that it helps analysts quickly explore data to spot actionable insights, without requiring IT intervention. It is a great tool for the application of Business Intelligence.
10. Tableau Big Data Analytics
Tableau is one of the most popular and fast-growing tools used in Business Analytics and Business Intelligence today. It manages vast volumes of data and turns data into actionable information. Since Tableau is used by almost every industry today, it has become one of the core requirements recruiters seek in Business Analysts.
11. Excel
While Excel might be one of the oldest tools in the industry, it is still the most widely used analytical tool across all industries. Excel is a powerhouse of features that allows you to:
Collect data
Perform statistical analysis
Make complex reports
Integrate with other Business Intelligence tools like Power BI
12. Power BI
Power BI is mainly used for data visualization. It comes with standard data visuals that you can make use of to build interactive reports, such as bar, column, line, map, matrix, pie charts, scatter, table and waterfall. Power BI is also really cost effective compared to other brands in the market, making it a great tool for freshers to learn.
13. Domo
Domo is a cloud company that specializes in Dashboarding tools and Data visualization. Domo is one the most favored tools out there, with an average user rating of 7.3/10. Another plus, Domo is completely code-free, making it perfect for freshers.
14. RapidMiner
RapidMiner is a powerful data mining tool that enables everything from data mining to model deployment, and model operations. It has a graphical user interface tool that allows you to link elements on a palette to conduct data analysis and data visualization.
Conclusion
This is why Business Analytics is known as a growing field with a lot of tools and platforms being made to facilitate the growing demand for data backed business insights. These are a few softwares for Business Analytics – used worldwide that cover a range of Business Analytics tasks from data visualization, data management to CRM. If you want to learn tools like Excel, Tableau and Power BI you should definitely check out our Business Analytics course. We cover a wide range of tools and techniques for Business Analytics (From Regression, Forecasting, A/B testing to Excel, Tableau etc.).
If you found this overview of Business Analytics tools helpful let us know in the comments below!
If you’ve started or are planning to start a career in Business Analytics, let us give you a fair warning. It can get pretty overwhelming quickly. There are large chunks of data to go through in very little time, and watching your peers accomplish it in seconds can lead to a whole new level of FOMO.
So here’s our suggestion.
Why not pick up these top 3 Business Analytics tools for freshers? They’re easy to learn, used in practically every organisation and are sure to give you an edge over others.
Microsoft Excel for data anaysis
Ouch! We apologise for the oldest Excel joke in the book. And we’re sure you must also be laughing at the suggestion of learning Excel because it can look and feel very basic.
But don’t get fooled by its easy interface. Excel is a powerhouse of features that allows you to:
Collect data
Perform statistical analysis
Make complex reports
Integrate with other Business Intelligence tools like Power BI
In fact, its user-friendly interface is what has made Excel the most preferred Business Analytics tool in all organisations. If you’re not familiar with some of the more analytical features of Excel, we recommend you start exploring these functionalities as a starting point:
Text to Column
As a future Business Analyst, you should know that you will not always have the luxury of getting your data in nice little columns as you’d like. More often than not, the data will be mixed up and you may have to separate them. For example, you may need to split customers’ full names into their first names and last names or separate out the year from the date of birth. In such cases, you can simply select the column, select Data >> Text to Column and specify the delimiter. (In names, first name and last name are separated by space, so the delimiter is space. The different parts of the date, like 27/07/2015, are separated by /. So the delimiter, in this case, is ‘/’)
Concatenate
A near opposite to the Text to Column, the concatenate feature of Excel allows you to combine two columns into one – for example, a column containing the first name and another column containing the last name can be concatenated automatically into a new column with the full name.
Sorting & Filtering
The sort and filter functions are going to be your handy assistants in the years to come. As a Business Analytics professional, you will constantly have to sort data in a particular order or filter out certain conditions, like regions, age groups, etc. and Excel allows you to perform these functions with ease.
VLookup
Vertical Lookup, more commonly known as VLookup, is another useful feature in Excel that enables users to find specific values in columns. Vlookup is beneficial in creating reports as it helps with combining data from two different spreadsheets into one.
Pivot Tables
Pivot tables allow you to create specific, condition-based summaries easily. For example, from your inventory records, if you want to analyse your consumer’s top 3 product buys in metro cities, you don’t have to manually segregate the data. You can simply apply a pivot table to the range of the data and you’ll get the results. What’s more, you can also convert it into a Pivot Chart to get a visual representation of the data for the purpose of presenting.
These are just some of the everyday yet powerful features of Excel. As you get deeper into it, you will find more functionalities that will help you in your day-to-day job. Excel, by itself, is great. But when Excel is combined with other tools, the world is your oyster!
Visualise with Tableau
The axiom “a picture is worth a thousand words” will soon become your favourite as you’ll start working on large volumes of data. Luckily, Tableau should help you out in the endeavour. Where Excel is essentially a spreadsheet tool that allows you to analyse data and perform calculations, Tableau is famous for its data visualisation abilities.
Founded in 2003, Tableau is one of the most popular and fast-growing tools used in Business Analytics and Business Intelligence today. It manages vast volumes of data and its flow and turns data into actionable information. It allows you to analyse and visualise data faster and more efficiently. Tableau accomplishes this with the Tableau Product Suite which consists of:
Tableau Desktop
Tableau Public
Tableau Online
Tableau Reader
There are many reasons why Tableau is the preferred choice for Business Analysts:
✔ For one, Tableau is really easy to understand. It has a very simple interface and its learning curve is generally regarded to be short. Hence, even as a beginner, you can pick up on the skills and stand out from your peers.
✔ Tableau can handle large volumes of data and can connect to 40 different data sources including local text files, Microsoft Excel, PDFs, JSON or databases and servers like MySQL Server, Microsoft SQL Server, among others.
✔ Tableau has an easy-to-use drag-n-drop feature which allows users to create interactive dashboards with just a few clicks.
✔ Tableau provides convenient options to collaborate with other users and instantly share data in the form of visualisations, sheets, dashboards, etc. in real-time
✔ The Ask data feature of Tableau makes it even more favoured by users globally. It’s the Google search version on our reports. All you need to do is to type your query about the data in natural language and you’ll get the most relevant answers from Tableau.
So, in a nutshell, Tableau is great. But Tableau is not the only Business Analytics tool in the market there. In fact, if you’re comfortable with the Microsoft interface, there is another platform, you must check out – Power BI.
Power up with Power BI
Tableau has a great range of products and is considered to be a very powerful tool, but it is also equally expensive. For beginners, whose access to data and need for analysis is reasonably limited, Power BI is a viable alternative. That, combined with its price which is almost 1/7th of Tableau, makes Power BI the go-to platform for Business Analytics.
Like Tableau, Power BI is also used for data visualisation. It comes with standard data visuals that you can make use of to build interactive reports, such as bar, column, line, map, matrix, pie charts, scatter, table and waterfall. Each of these visuals has its options for customisation to enhance presentation and functionality.
While it doesn’t support as many data sources as Tableau, Power BI allows you to connect to:
Cloud-based sources such as DropBox, Azure (Azure Data Warehouse), OneDrive, Google Analytics, and SalesForce,
Excel spreadsheets and CSV files
Data located on-premises, such as SQL Database
Further, Power BI is very famous for its natural language querying capabilities, where you can ask specific queries like “How did the sales team perform last quarter?”. All you have to do is double-click an empty part of your report canvas and use the ‘Ask a Question box’.
The best part about Power BI is that it has been created by Microsoft, which allows for easier integration with Microsoft applications, especially Excel.
Although Power BI is about 10 years younger than Tableau and has lots to grow for seasoned Business Analysts to work comfortably with, it’s an extremely comfortable, affordable platform for beginners and is sure to become powerful in the coming years.
Well, these are the top 3 platforms for beginner Business Analysts. You can learn more about them in depth and understand their real-world applications in our Business Analytics Certification program designed for college students.
Is there any platform you’d like to know more about in detail? Let us know in your comments below.
As data generation has become a common trend among humans over the last decade, the companies have started consuming this data to make complex business decisions. They rely on this information/insights to understand their consumer personas and accordingly plan their marketing, product release and much more.
But this raw data needs to get processed to make it useful. In simpler terms, a data analyst is required to first select through the collected information, determine its relevance and filter it to make it simpler to understand and get results.
When this data reaches a business environment, a business analyst uses this gathered information to apply it directly for making strategic business decisions and solving existing business problems.
Let’s read on more to know how a business analyst does this and explore how you can set yourself up for this course.
Skills for a Business Analyst
Business analysts are professionals who are responsible for analyzing organizational operations, its systems and processes, assessing its business model, identifying improvement areas, and accordingly providing suitable solutions. Skills fora business analyst are a combination of hard skills and soft skills which mean these are related to one’s technical skills and knowledge as well as his emotional intelligence. Business analyst skillscan be acquired not only through some sort of training, but more through experience that developed into ability to analyze and understand situations. A business analyst needs to perform multiple tasks; so they must have a strong combination of technical and non-technical skills.
Here are some of the crucial technical and personal skills for a business analystthat arerequired in order to perform efficiently and successfully in this field.
Programming Language Skills:
In today’s technology-driven world, a business analyst must have thorough knowledge of handling various tools and technologies to access and analyze the information. It is one of the mandatory skills needed for business analysts. They should have hands-on programming language experience to analyze massive data and visualize business models.
Review and Statistical Analysis of Data:
A business analyst must research and explore to gather all statistical data and analyze them to find out business solutions. The statistical analysis of data gives insights into many important factors, can identify gaps and help in risk assessment. One needs to have relevant IT and technological skills to be able to gather, review and analyze accurate information.
Financial Planning:
The analyzed data has to be used to find out the cost implications of the solution. Business analysts must be able to guide how to achieve the business objectives and goals by proper financial planning.
Analytical and Critical Thinking:
A business analyst should be clear about the organization’s goals and problems, and work towards finding the potential solutions. He must apply critical thinking and analytical approach to explore multiple options and prioritize business requirements even in the non-ideal situations.
Communication:
A business analyst uses communication & interpersonal skills at different phases to convey ideas, facts, and opinions to stakeholders. It also boosts confidence while facilitating meetings.
Negotiation and Decision Making:
Negotiation skills play a significant role in making technical decisions. Business analysts need to persuade people to view things differently, convince them to consider other alternatives, and ultimately get everyone to agree on how to implement the solution.
Business Analyst Career Path
All organizations need a business analyst who can collect, analyze, and apply data to guide them on best practices. This makes the business Analyst career path lucrative and exciting. However, to ensure a successful career path as a business analyst, you need to accomplish either a strong knowledge of information technology or a good business background. The business Analyst career path generally goes through the following steps:
· Earn a degree in accounting, finance, IT, etc.
· Get an entry-level job as a junior business analyst position.
· Become a subject matter expert (SME) by gathering a few years of experience
· Accumulate skills by handling practical situations
· Enhance skill-set by pursuing training and certifications in related courses
The Masters of Science (M.S) in Business Analytics program has opened up new career opportunities in a wide range of sectors, such as consulting, consumer products, retail and financial services. The Master’s in Data Science and Business Analytics program is designed to give hands-on experience to students in multiple areas by integrating the fields of analytics techniques, data management, information technology, and statistical analysis. This program enables students to become effective users of business information. The program is technically focused on the application of quantitative and qualitative technology tools to optimize business decisions. The (M.S) in Business Analytics program helps students to develop analytical and decision-making skills for informed decision-making relevant to specific industries.
Significant Roles of Data Analyst
There are multiple certification programs and courses available from a variety of educational institutions which help in skill-building for aspiring professionals in a more flexible time frame. All kinds of organizations today are hiring data analysts to effectively utilize the growing range of data they generate and collect, resulting in actionable outcomes to make or improve decisions. Firms in the fields of commerce, health care, manufacturing, and marketing use data analytics to improve processes and profit levels.
Below is a list of some of the significant roles that data analysts have to perform in various organizations.
Corporate strategy analysts will focus on analyzing company-wide data and advising management on strategic direction.
Business product analyst deals with the analysis of the attributes of a product and consequently advising on the optimal pricing pattern based on market feedback.
Social media data analyst utilizes data to build, monitor, and provide advanced technology solutions for social media platforms
Machine learning analyst is of high demand in industries that use machine learning experience on a variety of operations like data preparation, data feeds, and data analysis to make cognitive decisions.
What do Business Intelligence Analysts do?
The role of Business Intelligence Analysts in organizations is to collate and transform data into useful insights. With the help of analytics, visualization, and modeling techniques they can identify trends that can help to make business decisions leading to process improvement in the organization.
The Business Intelligence Analysts provide significant contributions in organizations that are ready to capitalize on the massive data. Business intelligence analysts always work on new ways of data collection and data analysis. The business intelligence analyst analyzes the data of the company itself as well as from competitors, in order to discover ways to improve the company’s performance. Business intelligence analysts review a company’s operations, processes, and policies, and suggest measures that can increase efficiency and profit margins.
Are You Geared up to Become a Business Analyst?
Data analytics career offers a wide variety of opportunities across industries because the demand is high, but the supply of expert people is limited. Those looking to enroll in a Data analytics career are required to gain expertise in the data analytics tools and techniques.
In today’s competitive environment, the business analyst is a valuable resource in organizations in guiding management to make tactical and strategic decisions. So a career in Data Analytics is excellent, and there are several opportunities available worldwide. If you want to be a business analyst, the upGrad Campus Business Analyst Course is the perfect platform for you. Taking this certification will help you land your dream job – Business Analyst. Click here to know more about the program.
*The placement figures represent the number of students placed by upGrad. Past record is no guarantee of future job prospects. The success of job placement/interview opportunity depends on various factors including but not limited to the individual's performance in the program, the placement eligibility criteria, qualifications, experience, and efforts in seeking employment. Our organization makes no guarantees or representations regarding the level or timing of job placement/interview opportunity. Relevant terms and conditions will apply for any guarantee provided by upGrad.